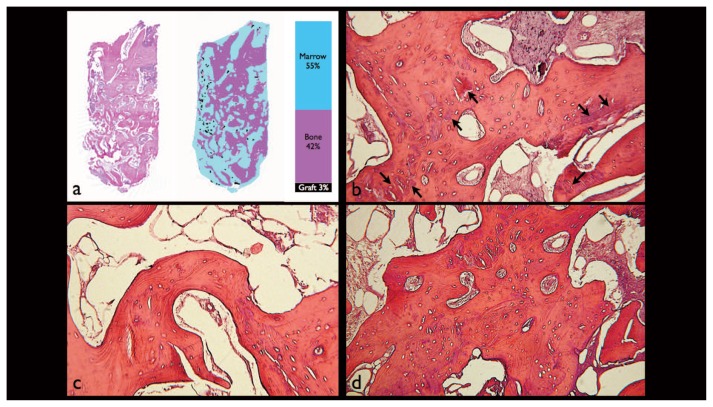
Figure 3.
a) Histomorphometric analysis of a sample. After identification and discriminative coloring of the 3 components (bone, marrow, graft), the image is primarily converted into an 8-bit grayscale and then into pseudo-colors in order to calculate the percentage extension of each area; b) the graft material granules are dispersed (arrows) and completely surrounded by bone trabeculae formed by secondary osteons (stained with hematoxylin-eosin, original magnification 100X); c, d) trabecular bone in various stages of remodeling (stained with hematoxylin-eosin, original magnification 100X).

