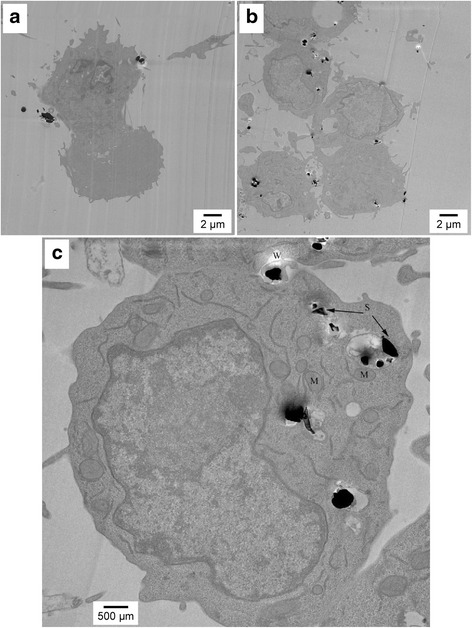
Fig. 2.

TEM images of AM after 1-h exposure of AM to (a) Coarse particles at 6,000x magnification, (b) UF particles at 6,000x magnification, and (c) UF particles at 20,000x magnification. In the higher magnification micrograph, the silica particles are marked S, the mitochondria are marked M, and W denotes a white area resulting from particles falling out of the resin. Figures present a representative image of the differences in AM uptake and handling of different sized crystalline silica particles
