Fig. 1.

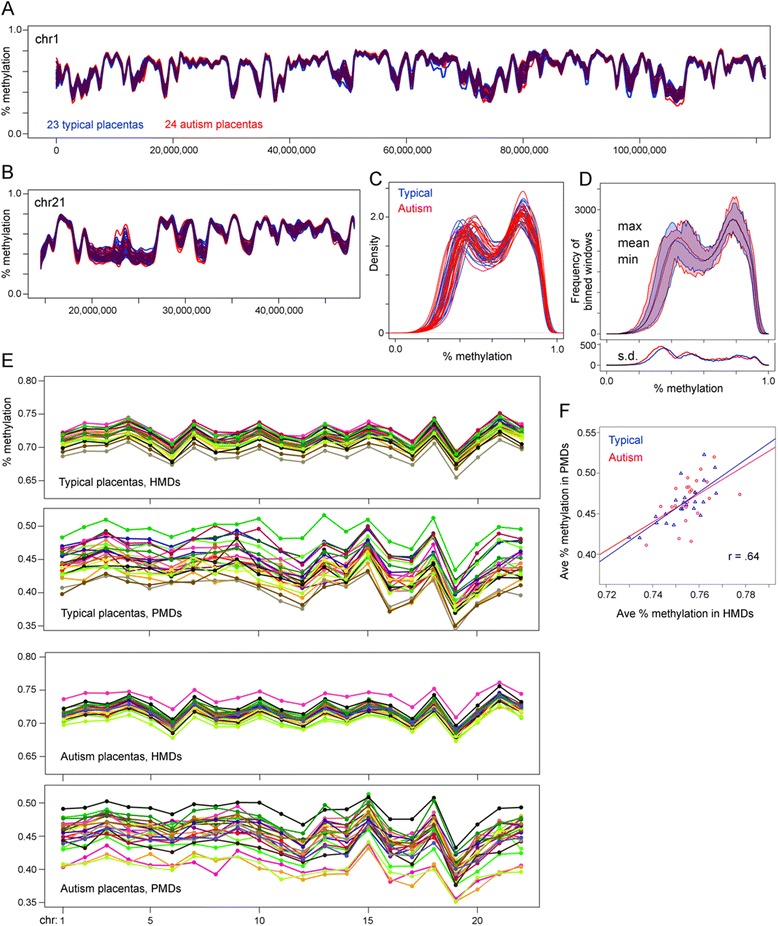
Genome-wide methylation landscape of MARBLES typical and autism placentas. a–d Average methylation in non-overlapping 20 kb windows tiled across the autosomes. CpG islands were not removed. a Methylation across the p arm of chromosome 1 and b the q arm of chromosome 21. Curves were smoothed with a first order local polynomial. Overlap between autism and typical is shown in maroon. c Distribution of average window methylation across all autosomes with kernel density smoothing. d Because of high curve overlap in c, the average window methylation was binned at 1% methylation increments for each sample, and the minimum, mean, maximum, and standard deviation were plotted for both typical and autism placentas. No additional smoothing was done. e Average methylation of CpG sites in PMDs/HMDs on each individual autosome. PMD/HMD boundaries were determined using a hidden Markov model on a combined set of 17 typical placentas. Each individual placenta has the same color in the HMD and PMD graphs. f Correlation between genome-wide methylation levels in PMDs and HMDs for each placenta. Least squares regression lines are shown for the typical and autism placentas. The Pearson correlation for all samples combined is 0.64
