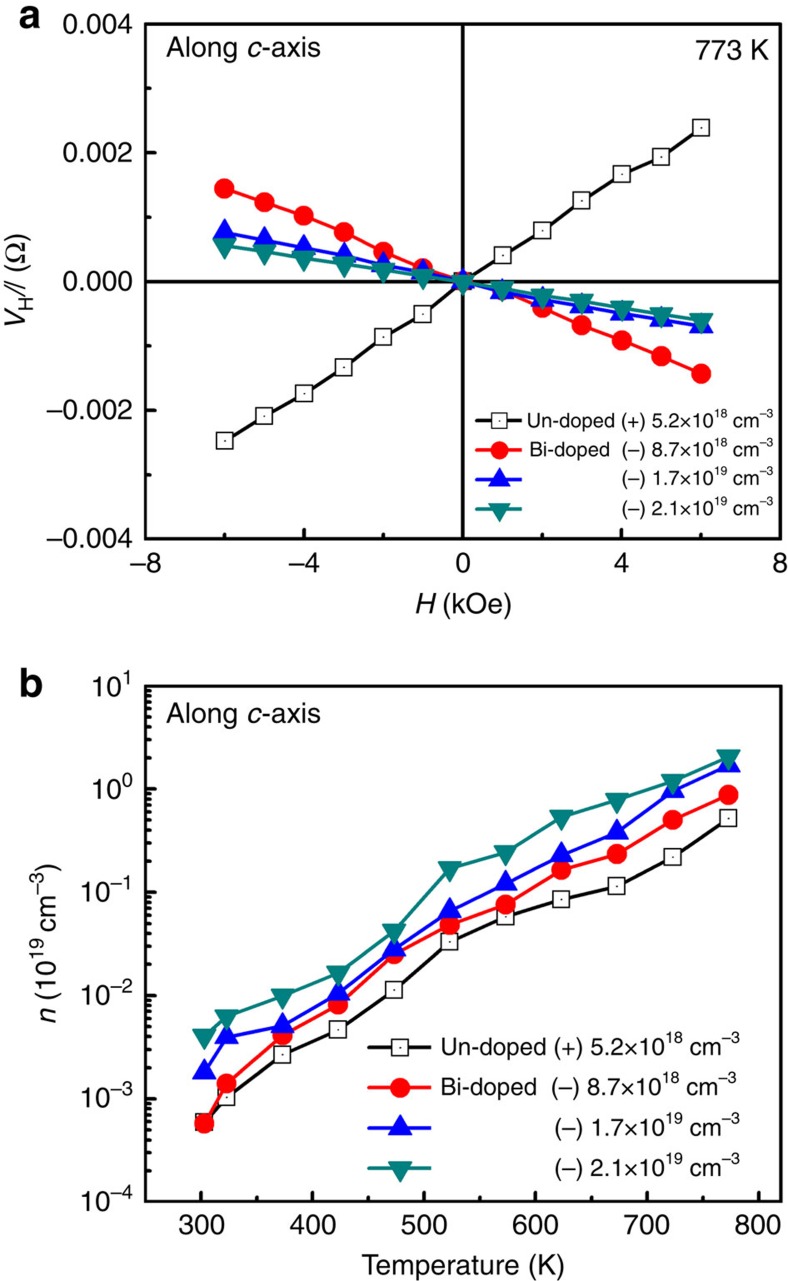
Figure 2. Hall transport measurements and carrier concentrations.
(a) VH/I versus magnetic field curves of undoped and different Bi contents—doped SnSe single crystals at 773 K. (b) Temperature-dependent carrier concentration of undoped and Bi-doped SnSe single crystals. The carrier concentration was determined from the linear fitting of VH/I versus magnetic field slope. Carrier concentration values at 773 K were used to distinguish samples such as (+) 5.2 × 1018 cm−3 for undoped SnSe, (−) 8.7 × 1018 cm−3 for 2% Bi, (−) 1.7 × 1019 cm−3 for 4% Bi and (−) 2.1 × 1019 cm−3 for 6% Bi at 773 K.

