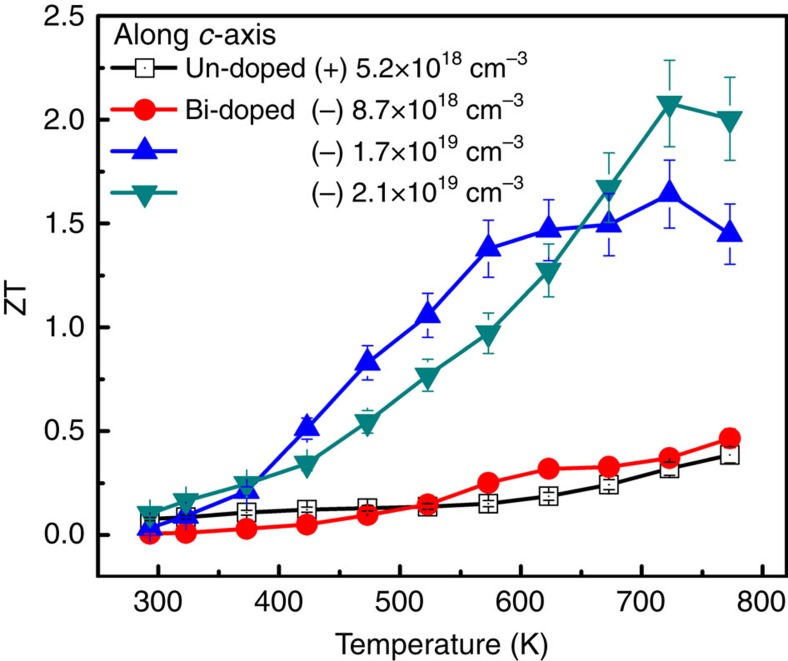
Figure 4. Thermoelectric figure of merit (ZT) along c axis.
Small ZT values were observed in undoped and light Bi-doped samples. ZT value can be dramatically enhanced with a high carrier concentration. The maximum ZT value along c axis is 2.1 at 733 K in the sample with carrier densities of 2.1 × 1019 cm−3. Error bars are described in Supplementary Note 1.

