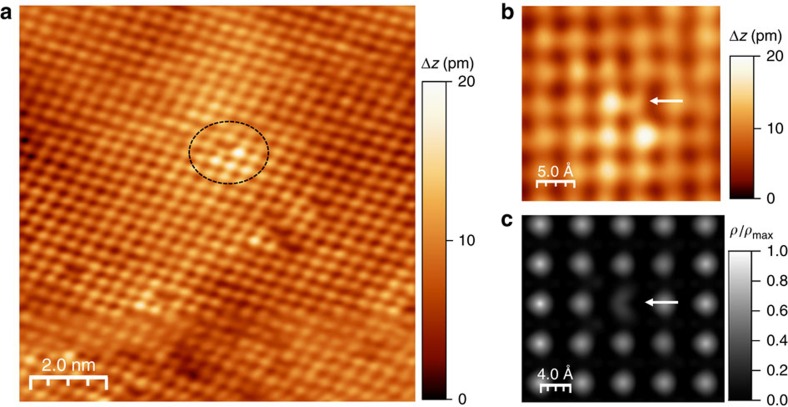
Figure 8. Topographic and simulated STM images of Bi-doped SnSe.
(a) STM topographic image of Bi-doped SnSe. The dotted ellipses indicate Bi dopants. (b) High resolution image of a Bi dopant taken from one of the circled areas in a. The height scale (Δz) is given by the colour bar on the right of the STM images. (c) Simulated STM image of SnSe supercell with Bi dopant at Sn site. ρ in the colour bar represents charge density (e Å−3). The white arrows in b,c indicate the substitutional Bi atoms occupying Sn site. All STM images were taken with Vb=−1.8 V and It=30 pA.

