
Figure 4.
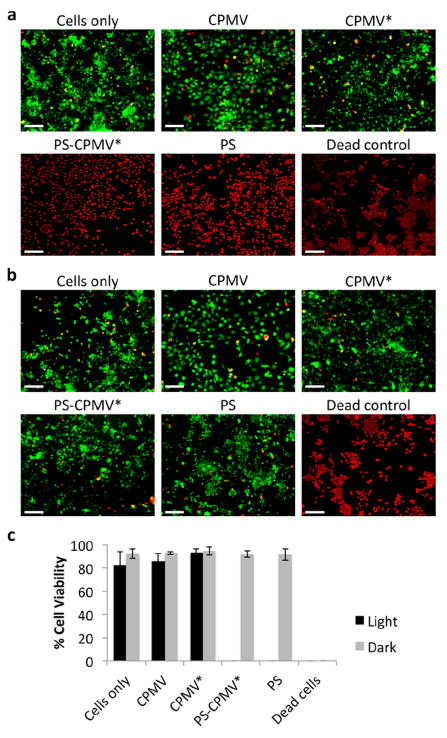
LIVE/DEAD assay of RAW 264.7 macrophages. (a) Representative images after photodynamic therapy of cells incubated with CPMV, CPMV*, PS-CPMV*, or PS and LIVE/DEAD cell staining. Incubation for 30 min with 70% methanol was utilized as a control for dead cells. Calcein-AM staining of live cells is shown in green, and ethidium homodimer-1 staining of dead cells is shown in red. Scale bar = 200 μm. (b) Dark controls show no cytotoxicity of CPMV formulations or PS alone in the absence of light therapy. Scale bar = 200 μm. (c) Quantification of percentage live cells as measured by ImageJ analysis. Two images for each sample in triplicate were analyzed, and error bars show the standard deviation.