Figure 5.

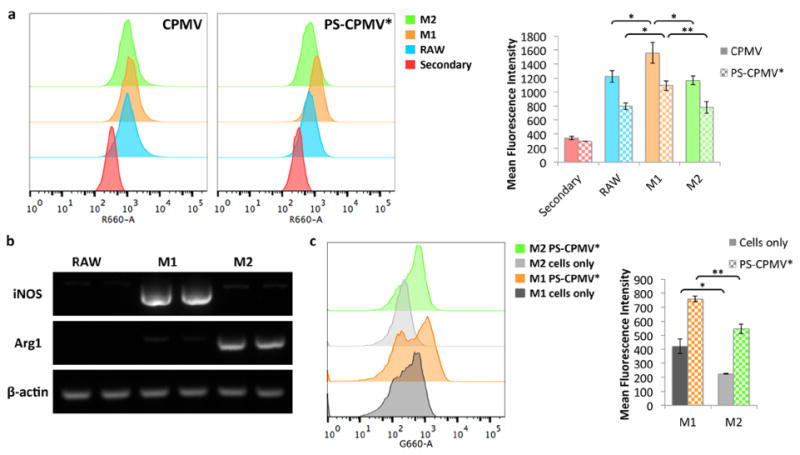
Macrophage polarization and comparison of CPMV association. (a) Flow cytometry analysis of CPMV and PS-CPMV* association with polarized macrophages show increased signal in M1 macrophages. Particles were stained using a rabbit anti-CPMV antibody followed by a secondary Alexa Fluor 647-labeled anti-rabbit antibody. Secondary only staining was used as the control, with similar results observed for cells without staining. Histograms are shown to the left, and quantification of mean fluorescence intensity is shown to the right. For the bar graphs, data for CPMV are shown as solid bars, while PS-CPMV* data are checkered, and statistical significance is indicated by asterisks (* p < 0.05, ** p < 0.01). (b) RAW 264.7 macrophage cells were polarized with treatment with either LPS and IFN-γ or IL-4 and verified by RT-PCR analysis for increased iNOS and Arg1 expression for M1 and M2 polarization, respectively. Treatment was performed in duplicate. Untreated cells were analyzed for comparison, and β-actin served as a loading control. (c) Flow cytometry analysis of PS-CPMV* uptake based on PS signal also revealed increased fluorescence in M1 macrophages compared to M2 macrophages. Histograms are shown to the left, and quantification of mean fluorescence intensity is shown to the right. For the bar graphs, cells only data are shown as solid bars, while PS-CPMV* data are checkered. Statistical significance is indicated by asterisks (* p < 0.05, ** p < 0.01).
