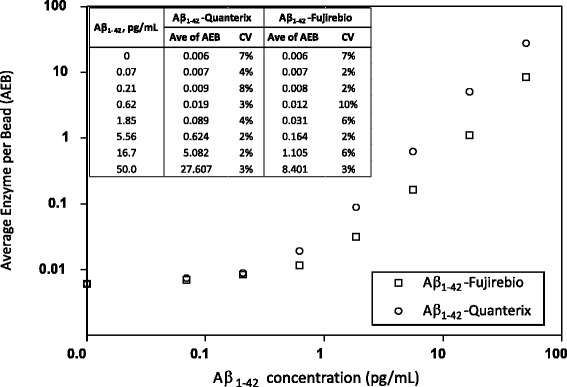
Fig. 1.

Representative dose-response curves using the amyloid-β 1–42 peptides (Aβ1–42) from Quanterix and Fujirebio. For each calibration curve, average enzymes per bead (AEB) (n = 3) and coefficient of variation (CV) of each calibration level are shown in the embedded table. The signals from the Quanterix Aβ1–42 peptide were approximately threefold higher than those from the Fujirebio Aβ1–42 peptide
