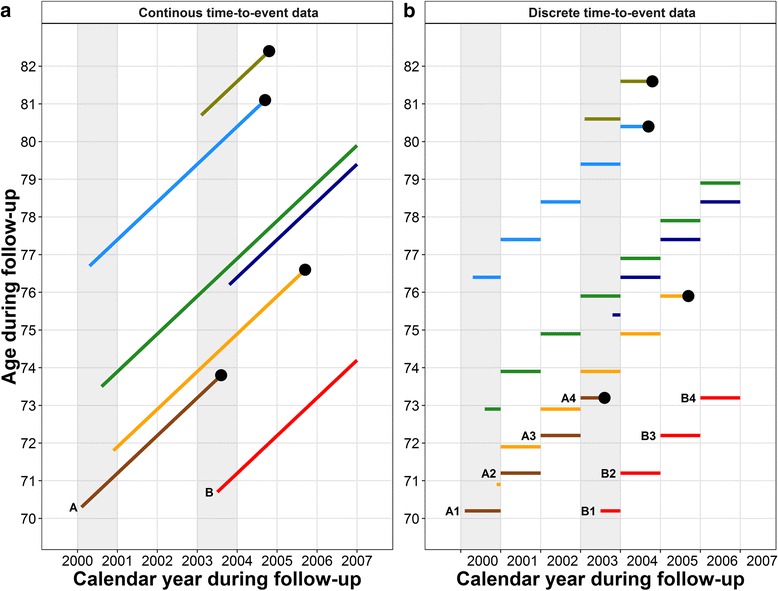
Fig. 1.

Follow-up of seven participants from 2000–2006 in continuous (1a) and discrete (1b) time-to-event format. The dot at the right end of lines represent death. Four participants were interviewed in 2000 and three participants were interviewed in 2003. All seven participants were followed up to the event or end of year 2006. For part 1a, both calendar year and age during the follow-up are shown as continuous variables. For part 1b, the time-to-event was split yearly; the y-axis shows the discretized age during the follow-up calendar year using the age at the first day of the year. The discrete age increased yearly with the follow-up
