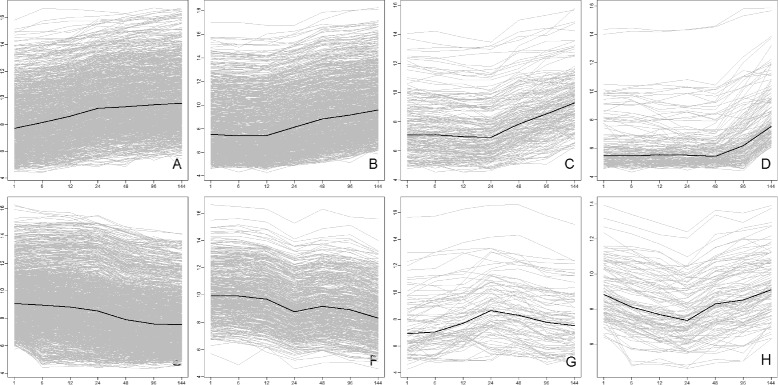
Fig. 6.

Dynamic patterns of the gene expression response in neuroblastoma cell line to treatment with ATRA. a INDUCED_IMMEDIATELY Genes in this group were induced immediately upon treatment with ATRA. b INDUCED_12 The activation of these genes by ATRA started at 12 hrs. c INDUCED_24 Genes in this group were induced in response to ATRA after 24 hrs. d INDUCED_LATE Genes in this group showed late induction: after 48 or 96 hrs. e REPRESSED These genes responded to ATRA immediately with the decrease of expression. f REPRESSED_CYCLIC These genes, involved in the cell-cycle, were repressed by ATRA. g SPIKED Genes in this group responded to ATRA with increase and then decrease of their activity, revealing a peak between 12 and 48 hrs. h CLEFTED This group summarizes the genes with a transient response to ATRA i.e their expression declined and then increased. The average gene expression profile for each group is depicted in black
