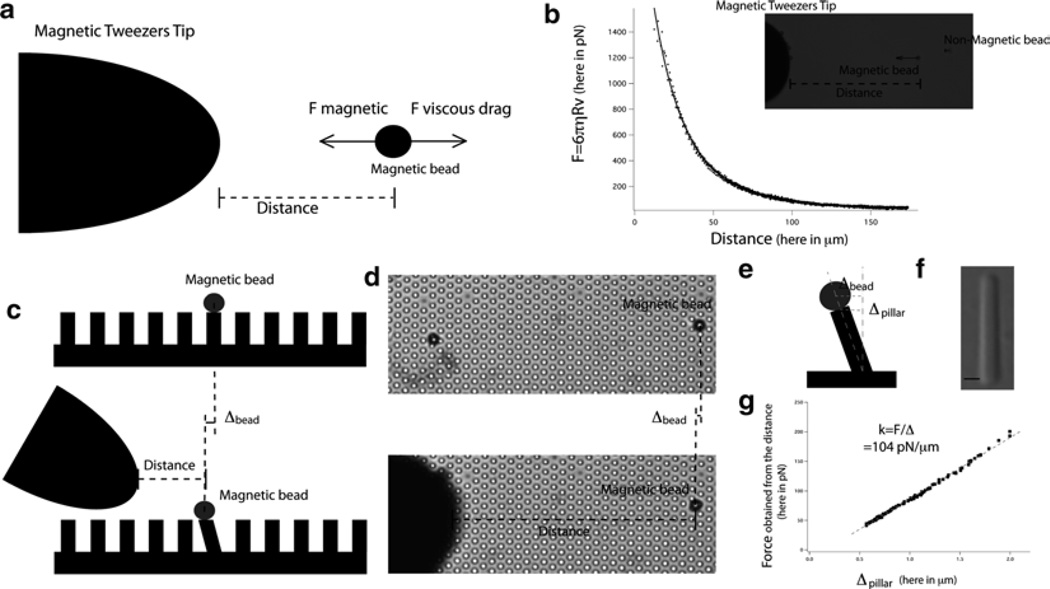
Fig. 5.
Calibration of the pillars using magnetic tweezers. (a) Schematic of the calibration of the magnetic tweezers. (b) An example of the calibration curve of the magnetic force exerted by the magnetic tweezers vs. distance and an optical microscopy image of the setup. (c) Schematic of the calibration of the pillars by the magnetic tweezers. (d) Optical microscopy images of the calibration of the pillars by the magnetic tweezers. (e) A schematic that explains the difference between the bead’s and pillar’s displacements. (f) Optical microscopy image of a pillar enabling accurate measurement of the pillar’s length. (g) An example of the calibration of the pillars with magnetic tweezers: the slope of the graph of the force of the magnetic tweezers vs. the displacement of the pillar gives the stiffness of the pillar.

