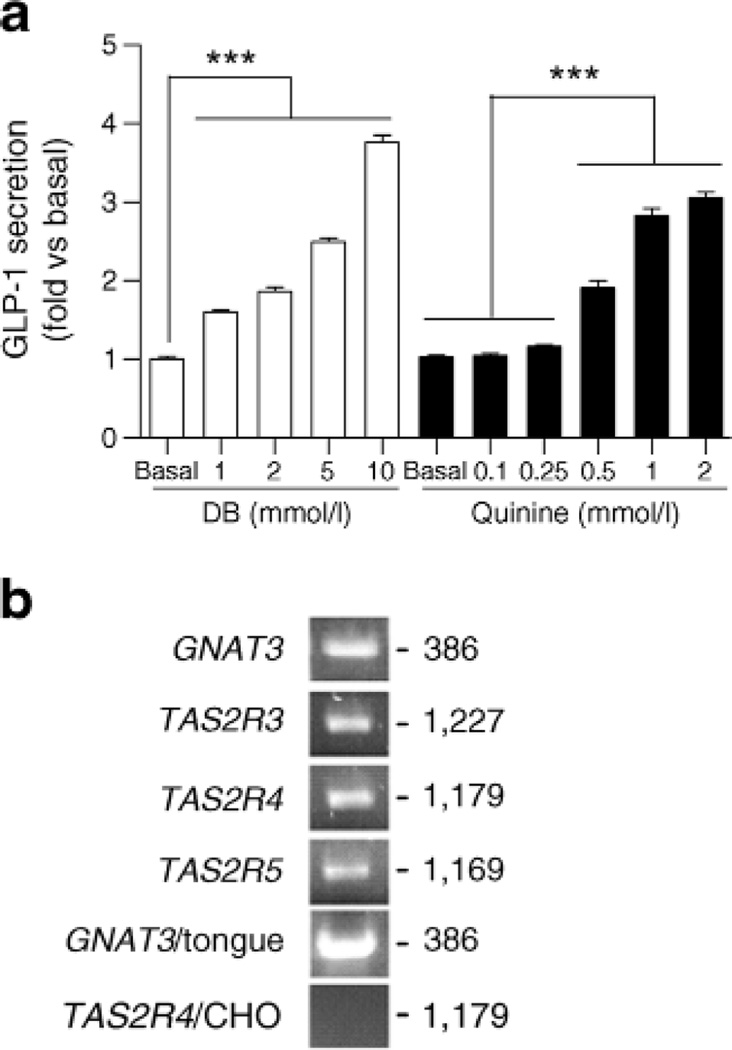
Fig. 1.
GLP-1 secretion from NCI-H716 cells in response to bitter tastants. (a) GLP-1 secretion from NCI-H716 cells treated wife DB or quinine. Data are expressed as mean ± SEM. ***p<0.001. (b) Expression of bitter taste receptor mRNAs in NCI-H716 cells determined by conventional PCR (first to fourth band). GNAT3/tongue was used as a positive control and TAS2R4/CHO cell was used as a negative control. Numbers indicate size of PCR products

