Fig. 6.
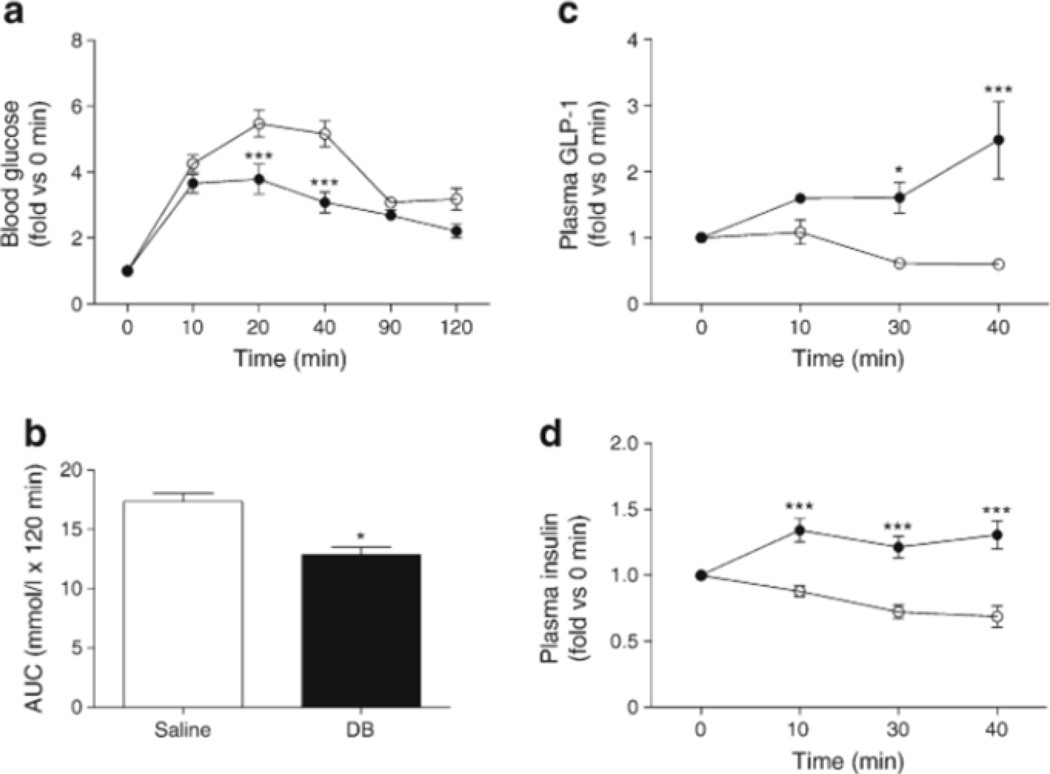
DB modulates blood glucose levels by increasing GLP-1 secretion in db/db mice, (a) Blood glucose levels in DB-(black circles) and saline- (white circles) treated db/db mice after glucose gavage (5 g/kg body weight), (b) AUC (120 min) of blood glucose after glucose gavage. (c, d) Plasma GLP-1 and insulin levels after glucose gavage (2 g/kg body weight). n=6–7 animals. Values are expressed as mean ± SEM. *p<0.05, ***p<0.001

