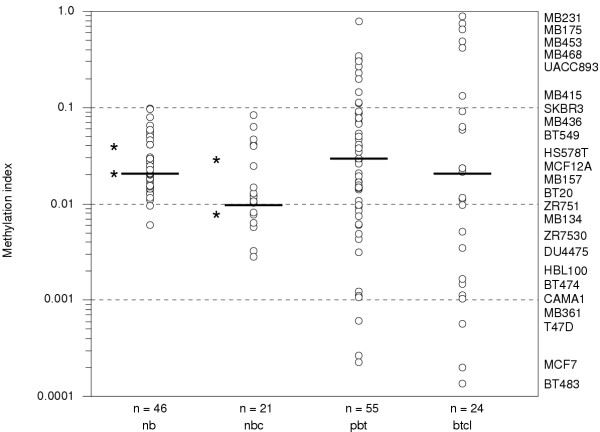
Figure 5.
CBFA2T3B promoter methylation levels assayed using second-round real-time MSP. The methylation levels in normal whole blood samples (nwb), normal breast counterparts (nbc), primary breast tumors (pbt) and breast tumor cell lines (btcl) were assayed at the Sp1 site shown in Figure 1C using real-time MSP. The y-axis represents methylation levels plotted as methylation indices [mi = m/(m + u)] on a log scale. Each white circle represents a different sample. The breast tumor cell lines examined are shown in descending order from high to low methylation. The horizontal bars mark the median methylation indices calculated for each group. The asterisks mark the interquartile ranges for normal groups. The median methylation indices and (interquartile ranges) were 0.02 (0.02–0.04) for nwb, 0.01 (0.008–0.03) for nbc, 0.03 (0.009–0.08) for pbt and 0.02 (0.002–0.3) for btcl. The median methylation index variance in each tumor group was statistically significantly different than the normal groups (P = .001); nwb/btcl (P < .0001), nwb/pbt (P = .009), nbc/btcl (P = .01), nbc/pbt (P = .05). The normal group median methylation index variances were not significantly different; nwb/nbc (P = 0.6).

