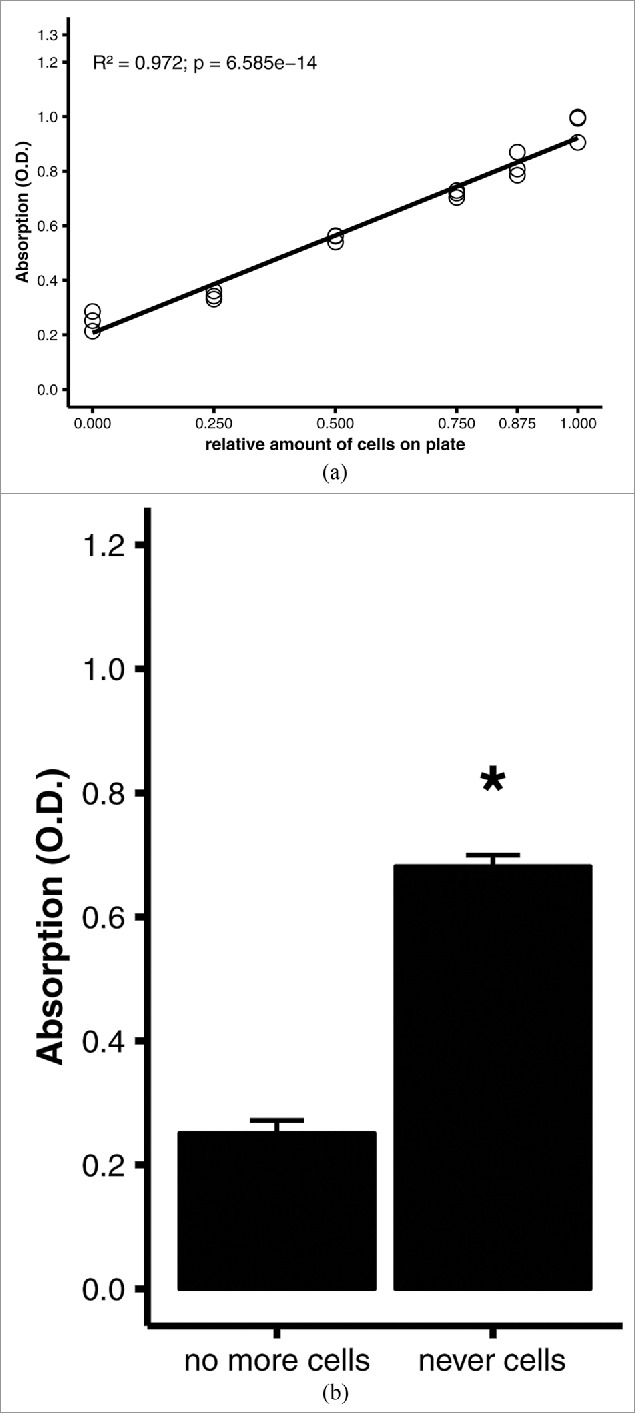
Figure 4.

Quantitative oil red O staining of differentiated adipocytes. 3T3-L1 adipocytes were differentiated on 6-well plates, then stained using the optimized protocol (see Materials and Methods). (A) Linear regression analysis of quantitative staining of varying amounts of cells in a well. All wells were initially covered with a confluent monolayer of preadipocytes; the amount of cells was varied experimentally by scraping off the cells. Efficacy of scraping was verified under the microscope. (B) Comparison of quantitative staining of a well that was stained after all adipocytes were scraped off (no more cells) and a well of a blank, cell-naïve polystyrene plate (never cells). Averages and standard errors of n = 3 replicates of a representative experiment. *, p = 0.001 by Student's t test.
