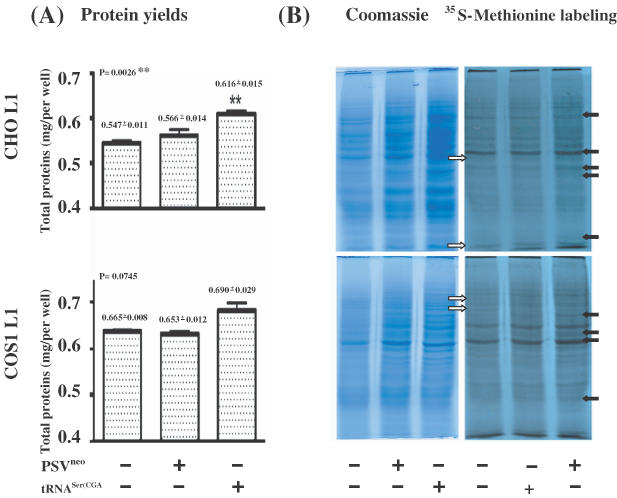
Figure 8.

Effects of the tRNASer(CGA) gene product on cellular proteins in CHO L1 and Cos1 L1 cell lines. (A) Yields of total cellular proteins. CHO L1 and Cos1 L1 cells (1 × 10⁶) were transfected with either the tRNASer(CGA) gene or vector pSVneo, or not transfected, and analyzed for total cellular proteins after 48 h. The yields of total cellular proteins shown in milligrams (mgs) over the histograms are the means of triplicates. Vertical bars indicate the standard errors (n = 3). P-values are shown on the top corner of the left side. Double asterisks indicate that the difference in total proteins in the CHO L1 cell lines without and with the tRNASer(CGA) gene transfection, and between the tRNASer(CGA) gene and vector pSVneo transfection is significant different (P < 0.01). (B) Synthesis of cellular proteins. An aliquot of 10 μg of the protein samples was separated by 10% SDS–PAGE in duplicates. Left panels show the PAGE gels stained with Coomassie blue. Right panels show the newly synthesized proteins labeled by [35S]methionine after the PAGE gels were dried on 3 M paper and exposed to X-ray film. Solid arrows on the right indicate that relative levels of the proteins are increased in both L1 cell lines after transfection of the tRNASer(CGA) gene, and empty arrows on the left indicate that relative levels of the proteins are reduced in both L1 cell lines after transfection of the tRNASer(CGA) gene.
