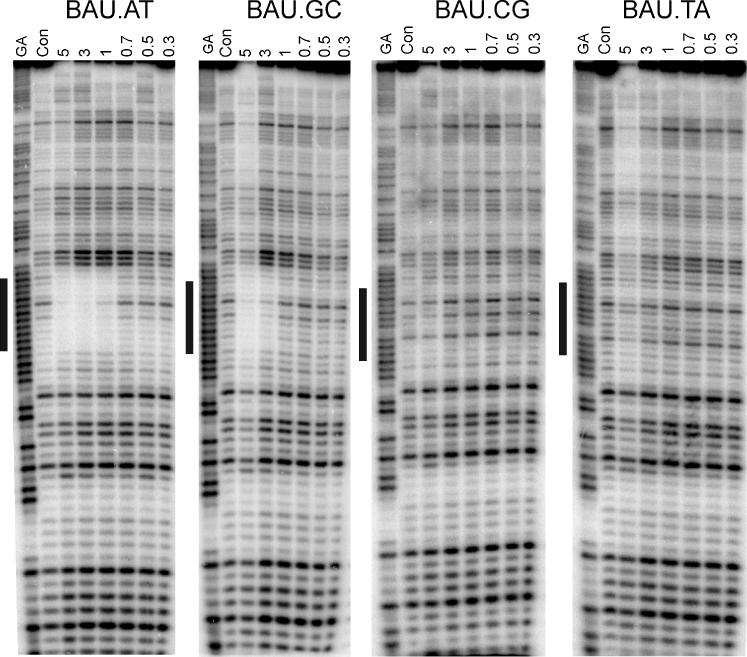
Figure 5.

DNase I footprints showing the interaction of TFO-4 [d(xCxCxTxTxTCT-3′), x = BAU] with DNA fragments that contain each base pair in turn in the centre of the oligopurine tract, opposite the base shown in boldface. The TFO concentration (μM) is shown at the top of each lane. The experiments were performed in 10 mM Tris–HCl, pH 7.0, containing 50 mM sodium chloride and the complexes were left to equilibrate for 30 min before digestion with DNase I. The lanes labelled ‘GA’ and ‘con’ represent Maxim–Gilbert markers specific for purines and DNase I cleavage of duplex DNA in the absence of TFO, respectively.
