
Figure 4.
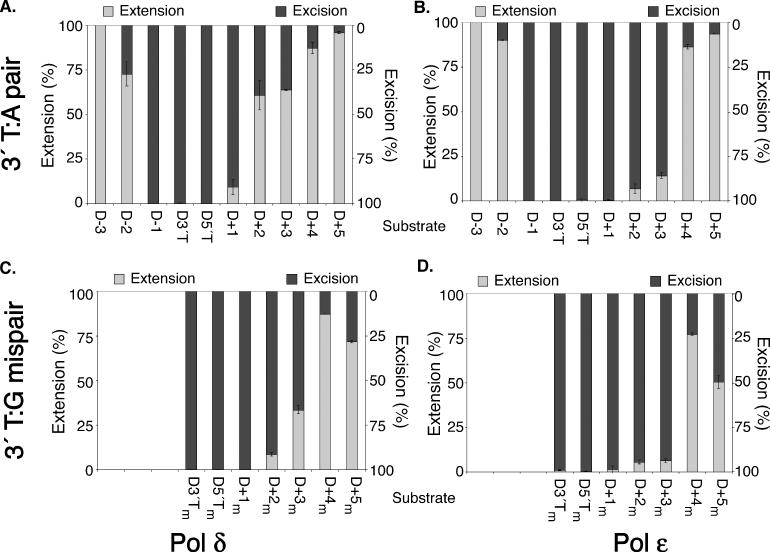
Polymerase/exonuclease partitioning using TT dimer-containing substrates. (A) Bar graphs indicating the relative level of extension products (gray sections, quantified on left y-axis) compared to excision products (black sections, quantified on right y-axis) resulting from activity of wild-type Pol δ on TT dimer containing substrates with matched primers. (B) Pol ε partitioning on TT dimer containing substrates and matched primers. (C) Pol δ partitioning on TT dimer containing substrates with a 3′ T:G mispair. (D) Pol δ partitioning on TT dimer containing substrates with a 3′ T:G mispair. The values shown are calculated from Figures 2B and 5B as the amount of extension products (bands longer than the primer) or excision products (bands shorter than the primer) relative to all reaction products. All reactions were run under conditions that produce a single cycle of interaction between DNA and protein.