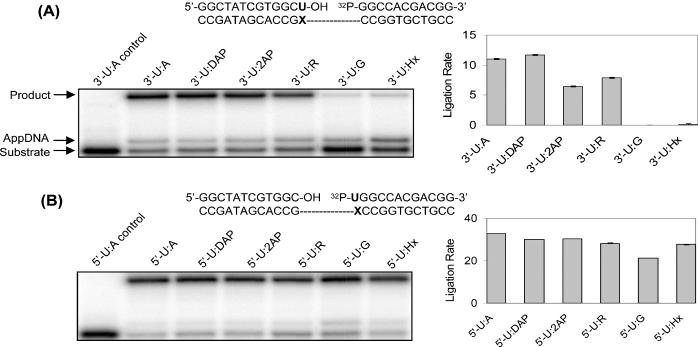
Figure 2.

Tth ligase activity on terminal U:purine base pairs on the 3′-hydroxyl end (A) and the 5′-phosphate end (B) of a ligase junction. The gel pictures were performed at 26.5°C for 30 min with 0.5 pmol of duplexes and 10 U of Tth DNA ligase in a total volume of 10 μl. AppDNA indicates the 5′-AMP intermediate of the ligation reaction. The sequences used are listed above the gel pictures, where X = A, DAP, 2AP, R, G and Hx. In order to keep the surrounding sequence constant, the ligase junction was shifted by one base when U was moved from the 3′-hydroxyl end to the 5′-phosphate end. The gray bars represent the ligation rates (femtomoles ligated per minute per unit ligase), which were averaged from two independent measurements. 3′ (5′)-X:Y indicates that X is on the 3′-hydroxyl (5′-phosphate) end of the ligase junction, and Y is on the template.
