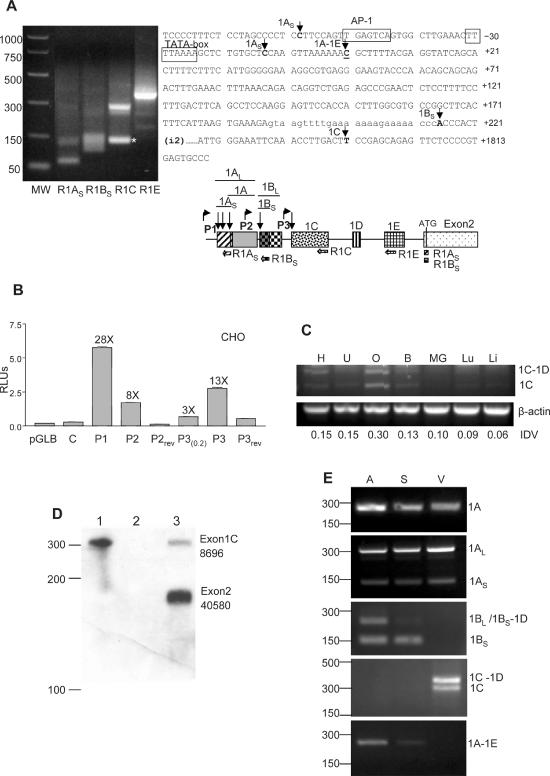
Figure 3.

Cell-type-specific expression of the new cx43 exons from three different promoters. (A) RLM-RACE analysis of mouse embryo full-length capped mRNA. Sequencing of the PCR-purified products determined the transcription start sites (tss) for exons 1A, 1B and 1C. With the R1C primer an unspecific product of smaller size was obtained (*). PCR molecular markers (MW) (Promega) are shown. The positions of the tss are indicated by arrows on the cx43 sequence (right part of the figure). The previously determined tss is underlined. The diagram shows the relative position of the reverse primers used in the PCR amplification of the 5′-RACE products. The locations of the putative promoters P2 and P3, with respect to the previously characterized cx43 promoter (P1), are shown by bent arrows. (B) Relative luciferase (Firefly/Renilla) activity of CHO cells transiently transfected with various pGL-Basic constructs. The constructs contained either the cx43 promoter P1 or the putative promoters P2 or P3 sequences in the 5′ to 3′ or the reversed (rev) orientation. The P3(0.2) construct contained 251 nt while the P3 construct contained 1091 nt of sequence upstream of exon 1C. As controls the empty pGLBasic vector (Promega) and the C construct containing 296 nt of cx43 intron sequence immediately upstream of exon1B were used (see Materials and Methods for further details). The fold induction of each construct with respect to the empty pGLB vector is indicated. (C) Semiquantitative RT–PCR analysis of exon1C expression in various mouse tissues, which includes heart (H), uterus (U), ovary (O), brain (B), mammary gland (MG), lung (Lu) and liver (Li). The RT–PCR reactions contained one set of primers annealing to the cx43 coding region and exon1C, and a second set of primers annealing to the β-actin gene (see Materials and Methods for primer sequences). The PCR-amplified products were separated in a 2% agarose gel and visualized by ethidium bromide staining. Positions of the amplified products corresponding to mRNAs either containing (1C-1D) or skipping exon1D (1C) are indicated. Integrated density values (IDVs) of the 1C bands, as determined by the Spotdenso program (Alpha Innotech, Inc.), are shown. (D) RPA analysis of total mouse ovarian RNA (lane 3). The probe was complementary to the entire exon1C (110 nt) and the contiguous 160 nt of exon2. The proportion of exon1C (8.5%) containing transcripts was calculated as a percentage of the exon2-containing transcripts. The IDVs of the bands, as determined by the Spotdenso program, are shown. As controls the probe was hybridized to yeast RNA in the absence (lane 1) or the presence (lane 2) of RNase. The sizes of the PCR molecular weight markers (Promega) are indicated on the left-hand side. (E) RT–PCR analysis of RNA prepared from various parts of the mouse heart which included atrium (A), septum (S) and ventricle tip (V). A common antisense primer annealing to the cx43 coding region and variable forward primers specific to each of the new exons (see Materials and Methods) were used in the amplification. Products were analyzed in a 2% agarose gel and visualized by ethidium bromide staining. Subcloning and sequencing of the bands confirmed that they contained the cx43 UTR1A, 1AL, 1AS, 1BL, 1BS-1D, 1BS, 1C-1D, 1C and 1A-1E sequences, as indicated on the right-hand side of the panels. On the left, the positions of the molecular weight markers (PCR markers; Promega) are indicated.
