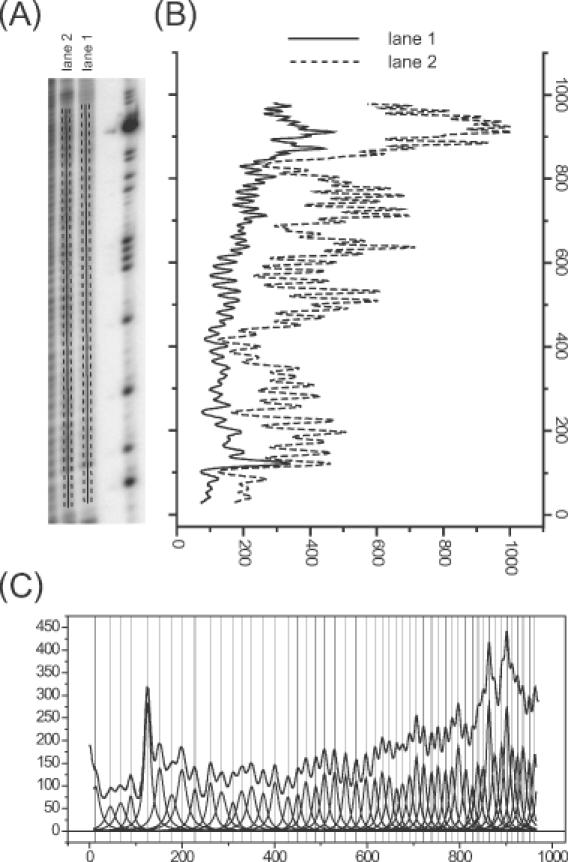
Figure 1.

An overview of the peak-fitting procedure. (A) A portion of the phosphor storage image of a hydroxyl radical footprint of RNA. The ImageQuant software was used to draw the lines that define the line density profiles shown in (B). The dashed lines on either side of the solid one denote the horizontal boundaries of each line; the software averages the pixel density values of pixels between these boundaries for each vertical increment in the line profile. Lanes 1 and 2 differ by the presence of MgCl2 in lane 2 to fold the RNA into a discrete tertiary structure. (B) The line profiles showing the average density for each row of pixels up the line from the bottom to the top of the gel. (C) The fit of the line profile for lane 1 to a family of Lorentzian curves as described in the text. Each Lorentzian peak corresponds to an individual band.
