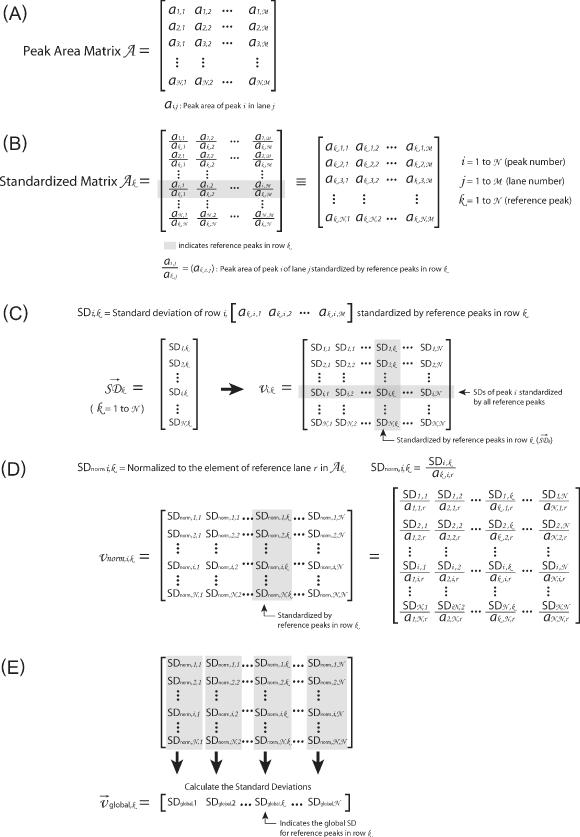
Figure 2.

This figure outlines the matrices and transformations used to ‘standardize’ the data. (A) The ‘peak area matrix’ into which the results of the Lorentzian peak areas are transferred. (B) Within a peak area matrix, each row is divided by reference row ak,j in order to convert to relative values independent of differences in the total intensity. This transformation, termed ‘standardization’, is repeated for each row resulting in a family of standardized matrices, Ak, for k = 1 → N where N is the total number of bands analyzed. (C) The standard deviation of each row for each matrix Ak and the values entered into the vector  (k = 1 → N). The resultant vectors
  are assembled into the ‘standard deviation matrix’, Vi,k. Each row of this matrix presents the standard deviations of peak i standardized by each reference peak. (D) To compensate for the difference in standard deviations due to the original peak area, each column
  in matrix Vi,k is divided by the reference peak area that was used to calculate the standard deviations. The resultant is entered into the vectors
  that are assembled into the ‘normalized’ matrix Vnorm,i,k. (E) The global standard deviation for each matrix Ak is calculated from the each column of Vnorm,i,k and the resultant entered into the vector
  whose values are global measures of the quality of reference row k in Ak.
