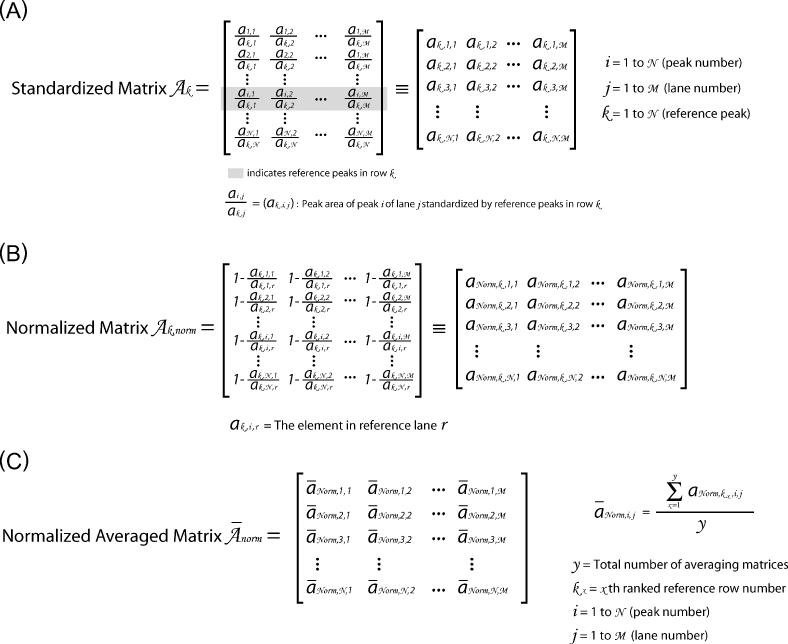
Figure 3.

An outline of the transformation of the ‘standardized’ data to ‘relative protection’ values that range from zero to one where one denotes complete protection and negative numbers denote enhancements in •OH reactivity. (A) The standardized matrices Ak are ranked based on the quality calculation described in the text. (B) Each element in matrices Ak is divided by the element in the reference lane (in same row) and then subtracted from 1. (C) The top-ranked standardized matrices (typically five) are averaged to generate the normalized averaged matrix (Ānorm) that is then plotted for inspection or subject to further analysis.
