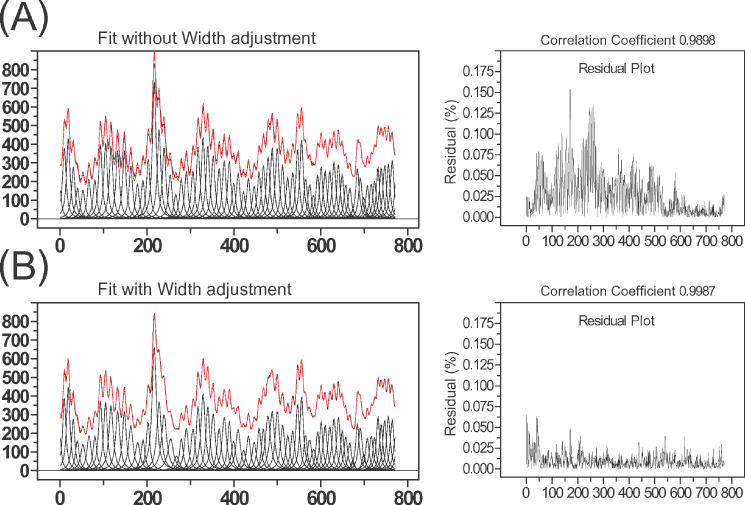
Figure 5.

(A) The left panel shows the results obtained following fitting without peak width assignment prior to the chi-square minimization routine. The initial peak widths are uniform and the peak width boundaries are constrained to ±15% of initial value. The residual plot (right panel) shows substantial error. Since the peak width was not adjusted prior to minimization, some peak widths that reached the boundaries could not converge to their minimum and are thus trapped at values that are narrower or wider than they should be. (B) The left panel shows the results obtained following assignment of the initial peak widths using Equation 6 followed by adjustments as described in the text using the same fitting conditions as in (A). The significant improvement in the residuals is seen in the right panel. Since the peak widths are assigned prior to chi-square minimization routine, the values can be optimized within the 15% of boundaries.
