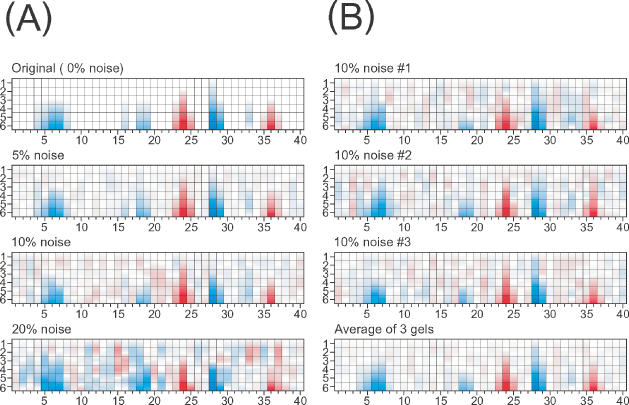
Figure 8.

(A) The top panel is a simulated ‘perfect’ footprint pattern. The lower panels have increasing amounts of random error introduced into the simulated peak area matrices demonstrating the degradation of standardization when ≥10% noise is present in the data. (B) However, data quality can be improved by averaging multiple gels. The top three panes represent simulations into which the 10% noise was independently introduced. The bottom panel shows that averaging these three simulations recovers the simulated protection pattern at a level of 5% error.
