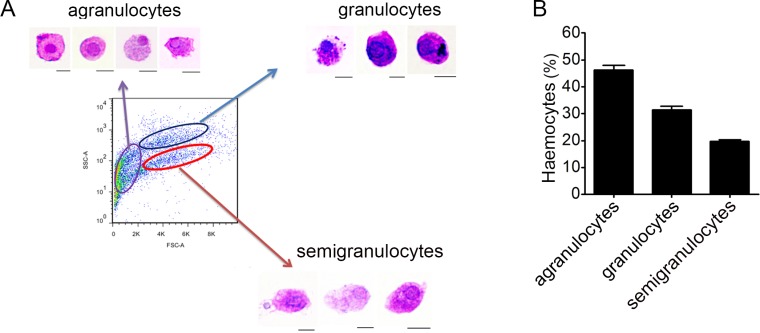
Figure 1. Flow cytometric analysis and May-Grunwald-Giemsa (MGG) staining of haemocytes from C. gigas.
(A) Haemocytes were categorized into different subpopulations by flow cytometry followed by MGG staining analysis. Bar: 5 µm. (B) The percentages of each subpopulation were calculated with statistically analysis. Results are means ±S.E.M. (n = 6).

