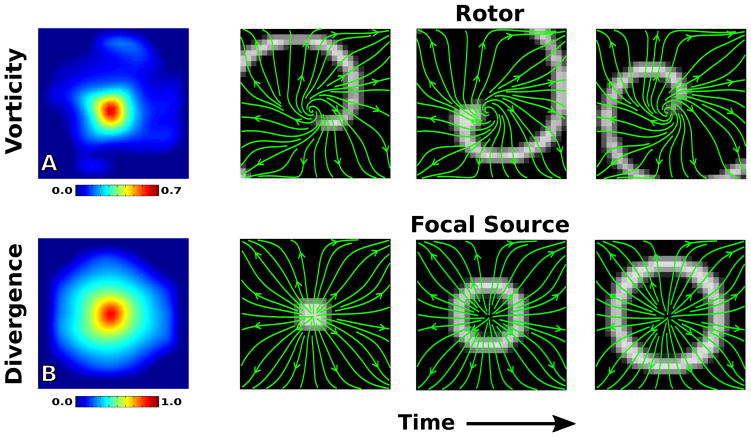
FIG. 2.
[Color Online] Flow field analysis of a simulated rotor (top) and focal source (bottom). A. The vorticity map records a significant elevation at the rotor core. B. The divergence map records a significant elevation at the site of the focal source. The right panels represent screenshots of the activation front at consecutive times throughout the recording, with streamlines of the flow field plotted in green.

