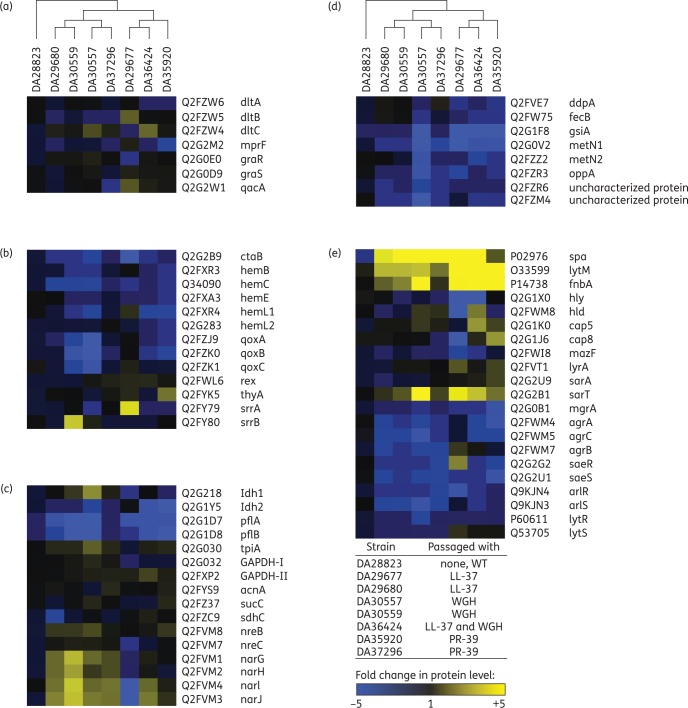
Figure 2.
Stable AMP resistance is conferred by reduced AMP uptake. Heatmaps of selected protein expression profiles grouped into categories based on their biological roles: (a) AMP resistance determinants; (b) electron transport chain; (c) metabolism; (d) transporters; and (e) virulence factors. S. aureus strains (AMP-resistant mutants or WT) are indicated above each column and protein expression is shown in rows. Proteomics analysis was performed using MS in bacterial cells derived from exponential growth in TSB medium in the absence of AMP selection as described in the Materials and methods section. Each column represents the average fold change calculated relative to WT (DA28823) for the indicated protein. All expression experiments were performed with two biological replicates. Changes in protein expression levels are represented in colour: yellow indicates increased protein levels and blue indicates decreased protein levels relative to WT. Data are available via ProteomeXchange with identifier PXD004036.

