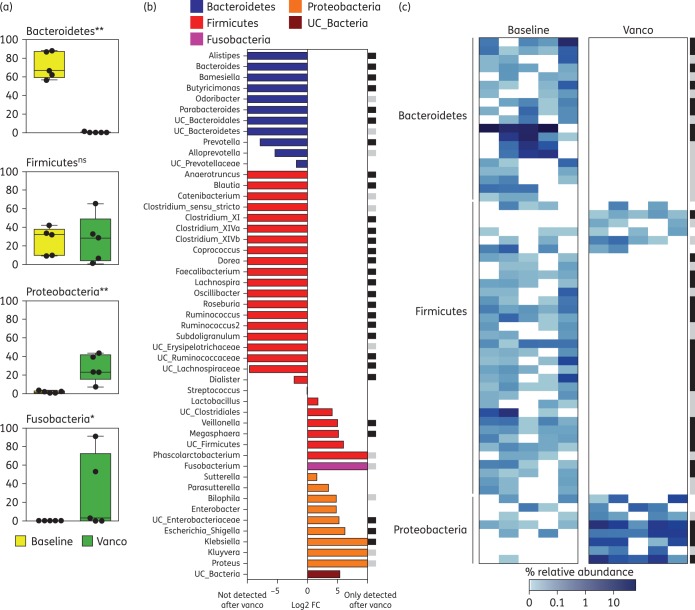
Figure 2.
The abundance of the majority of taxa and OTUs is altered during vancomycin treatment. (a) Relative abundance of different phyla in patients treated with vancomycin at baseline or 2 weeks after treatment initiation (Vanco). Only phyla that are present in at least 50% of the patients at baseline or after vancomycin treatment are shown. **P < 0.01, *P < 0.05, FDR < 0.2, two-tailed Wilcoxon test. ns, not significant. (b) Log2 average fold change (FC) between the genera abundance from samples obtained immediately after vancomycin treatment compared with their respective baseline samples. Only genera that are present in at least 50% of the patients at baseline or after vancomycin treatment are shown. Genera are sorted by phyla, FC difference and then alphabetically. UC, unclassified; vanco, vancomycin. (c) Heatmap representing the relative abundance (%) of OTUs present in at least 50% of the patients at baseline or after vancomycin treatment, showing a depletion of all prevalent Bacteroidetes OTUs and most Firmicutes OTUs. Additional analysis including all detected OTUs confirmed the depletion of all baseline OTUs from the Bacteroidetes phylum (not shown). For both (b) and (c): black squares indicate significant changes (P < 0.05, FDR < 0.1); grey squares indicate close to significance changes (P < 0.073, FDR < 0.1); two-tailed Wilcoxon test. n = 5. This figure appears in colour in the online version of JAC and in black and white in the print version of JAC.

