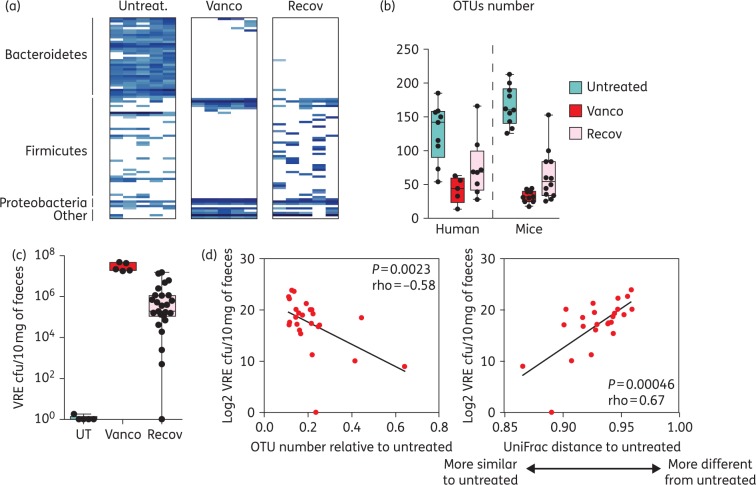
Figure 5.
Microbiota recovery rate after vancomycin cessation influences the level of susceptibility to VRE intestinal colonization in mice. (a) Heatmap showing the most prevalent OTUs (≥10 counts per group of mice) found in the faeces of mice treated with vancomycin for 7 days (Vanco), 2 weeks after antibiotic cessation (Recov) or in mice that remained untreated (Untreat.). n = 5 per group. (b) Number of OTUs identified in faecal samples from untreated mice or humans, or mice/humans that were treated with oral vancomycin, the day the treatment was stopped (Vanco) or 2 weeks post-antibiotic cessation (Recov). Boxes extend from the 25th percentile to the 75th percentile. The line in the middle of the box represents the median. Whiskers extend from the minimum value to the maximum value. n = 5–12 per group. (c) VRE cfu/10 mg of faeces 2 days post-VRE inoculation in untreated mice (UT), mice that received vancomycin for 1 week and were inoculated with VRE immediately after vancomycin therapy (Vanco) or were inoculated 2 weeks post-antibiotic cessation (Recov). n = 5 for the UT and Vanco groups and n = 25 for the Recov group. (d) Correlation analysis between the y-axis variable (log2 VRE cfu/10 mg of faeces detected the second day after VRE inoculation in mice that recover for 2 weeks after vancomycin administration) and the x-axis variable, which is either (i) the number of OTUs identified in mice, the day of VRE inoculation, divided by the average number of OTUs identified in untreated mice, or (ii) the microbiota similarity between VRE-colonized mice, the day of VRE inoculation and untreated mice (based on UniFrac distance, see the supplementary methods). n = 25. This figure appears in colour in the online version of JAC and in black and white in the print version of JAC.

