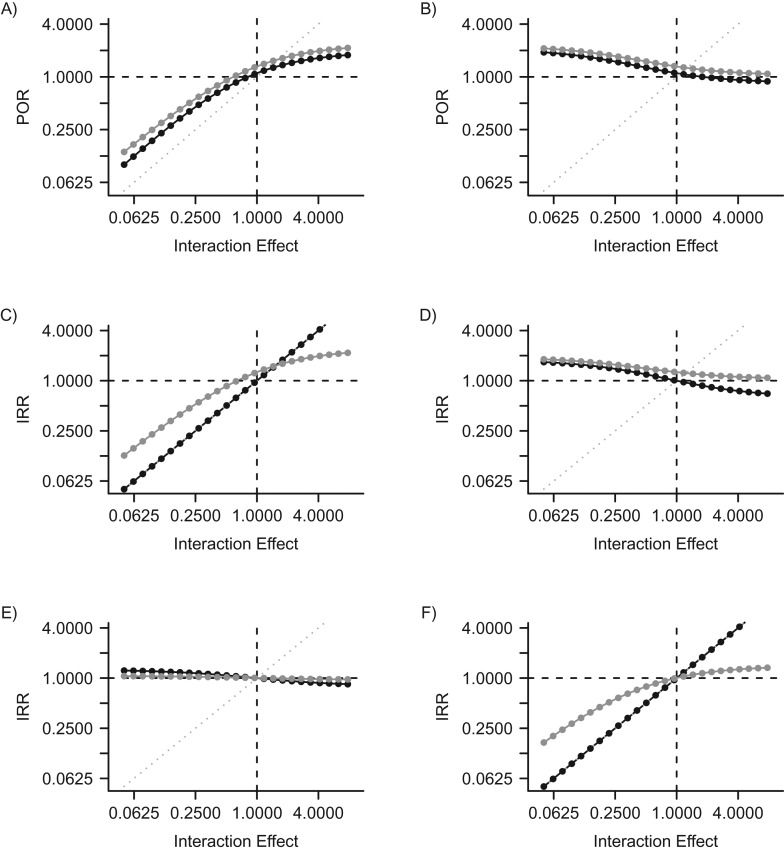
Figure 5.
Estimated adjusted measures of association between 2 types of human papillomavirus (HPV), type 1 and type 2, when interactions are modeled. The y-axis corresponds to associations measured in simulated epidemiologic studies. The x-axis represents the actual modeled underlying interactions. A) Prevalence odds ratio (POR) for HPV type 2 infection in HPV type 1-infected versus -uninfected individuals according to interaction effects caused by current infection (χ2). B) POR for HPV type 2 infection in HPV type 1-infected versus -uninfected individuals according to interaction effects caused by immunity (φ2). C) Incidence rate ratio (IRR) for HPV type 2 infection in HPV type 1-infected versus -uninfected individuals according to interaction effects caused by current infection (χ2). D) IRR for HPV type 2 infection in HPV type 1-infected versus -uninfected individuals according to interaction effects caused by immunity (φ2). E) IRR for HPV type 2 infection in HPV type 1-immune versus -nonimmune individuals according to interaction effects caused by current infection (χ2). F) IRR for HPV type 2 infection in HPV type 1-immune versus -nonimmune individuals according to interaction effects caused by immunity (φ2). Gray points correspond to associations measured in the overall population, adjusted for sexual activity level. Black points correspond to associations measured in analyses restricted to at-risk partnered individuals (persons in partnerships with HPV type 2-infected partners). Left-hand panels (A, C, and E) show the influence of interaction effect χ2—the relative probability of HPV type 2 infection per sex act with an infected partner among persons who are HPV type 1-infected compared with persons who are HPV type 1-susceptible. Right-hand panels (B, D, and F) show the influence of interaction effect φ2—the relative probability of HPV type 2 infection per sex act with an infected partner among persons who are HPV type 1-immune compared with persons who are HPV type 1-susceptible. Values to the left of 1.0000 on the x-axis correspond to modeled competitive interactions, while values to the right of 1.0000 correspond to modeled facilitative interactions. The dotted gray line represents the theoretical line of equality, where epidemiologic measures of association would validly estimate the actual modeled interactions. Both axes use a base-2 log scale.

