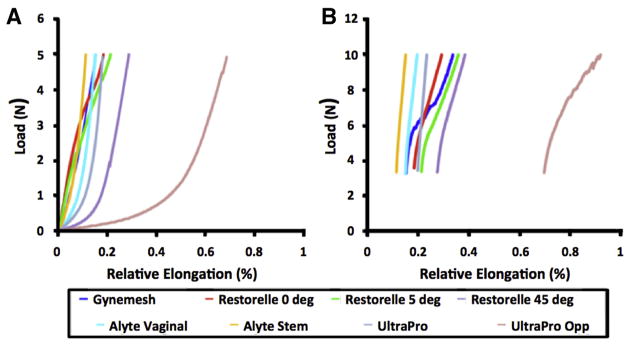
FIGURE 7. Representative load-elongation curves for all groups tested.
Meshes display a wide range of responses from 0–5N, a, because of initial pore geometry and orientation of mesh fibers along the loading axis. b, Because of the time required to image samples at 5N, each mesh underwent stress relaxation before application of 10N of load.

