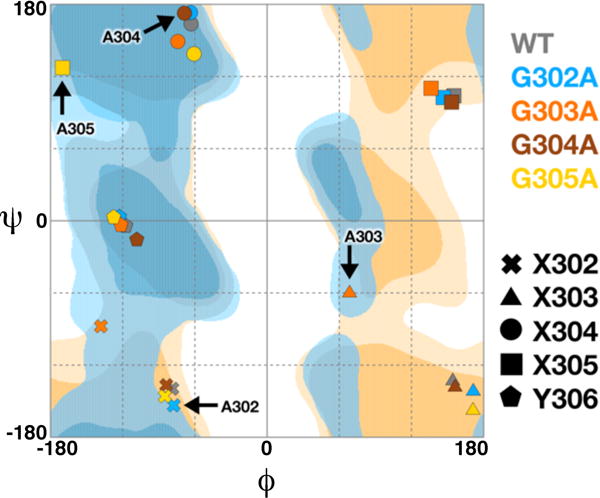
Figure 5.

Ramachandran plot for the glycine-rich loop G302GGGY in wild-type and mutant HDAC8 enzymes. Symbols are defined in the key and colors are consistent with those in Figures 3 and 4: G302A HDAC8, blue; G303A HDAC8, orange; G304A HDAC8, brown; G305A HDAC8, yellow. Regions of the Ramachandran plot are indicated as follows: generally favored (dark blue), generally allowed (light blue), glycine favored (dark yellow), and glycine allowed (light yellow). Plot generated using RAMPAGE.43
