
Figure 2. The Effect of Exercise on Plantarflexion Strength and Dorsiflexion Strength across 24 Months.
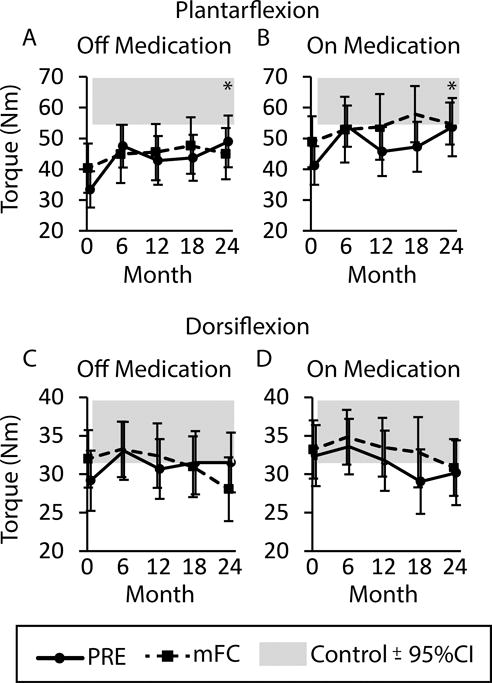
Data are plantarflexion strength (A) off medication and (B) on medication and dorsiflexion strength (C) off medication and (D) on medication for the PRE group (solid line) and mFC group (dashed line). Asterix (*) indicate a significant main effect of time with a significant difference from baseline at 24 months (p < 0.05). All data are presented as ± 95% confidence interval (CI). The grey shaded bar represents the 95% confidence interval surrounding the mean value for healthy controls.