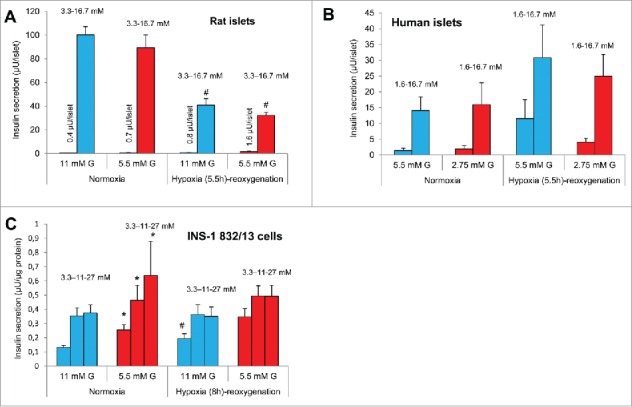
Figure 3.

Effects of hypoxia followed by re-oxygenation on insulin secretion after pre-culture at different glucose (G) concentrations. Levels of insulin release after culture at half standard glucose are indicated by red bars and standard glucose by blue bars. (A) Insulin release from rat islets at 3.3 and 16.7 mM G, #p < 0.02 for the effect of hypoxia, n = 4. (B) Insulin release from human islets at 1.6 and 16.7 mM G, n = 4 (one or 3 experiments per donor, 4 donors). (C) Insulin release from INS-1 832/13 cells at 3.3, 11 and 27 mM glucose, *p < 0.05 for the effect of culture at half standard G, #p < 0.05 for the effect of hypoxia, n = 5. Effects of hypoxia at standard G were previously reported.13 All data are mean ± SEM.
