
Figure 4.
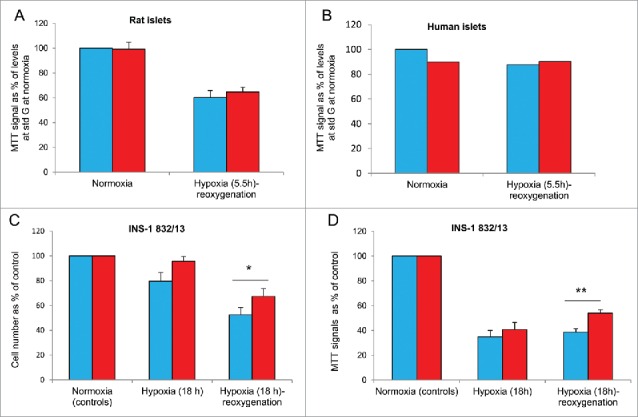
Effects of hypoxia on viability after pre-culture at different glucose (G) concentrations. Blue bars denote pre-culture at standard (std) glucose (for rat islets and cells: 11 mM, for human islets: 5.5 mM), red bars at half standard glucose. (A) Rat islets were exposed to 0.8% oxygen during hypoxia. There was no significant effects due to glucose concentrations on MTT signals, n = 11. (B) Human islets, n = 2 (2 experiments per donor, 2 donors). (C and D) INS-1 832/13 cells. Cell number is depicted in (C) and MTT signals in (D), after 18 h of hypoxia. Attenuating effects on hypoxia-reoxygenation by half vs. standard glucose were significant *p < 0.03 (C) and **p < 0.002 (D), n = 4-5.