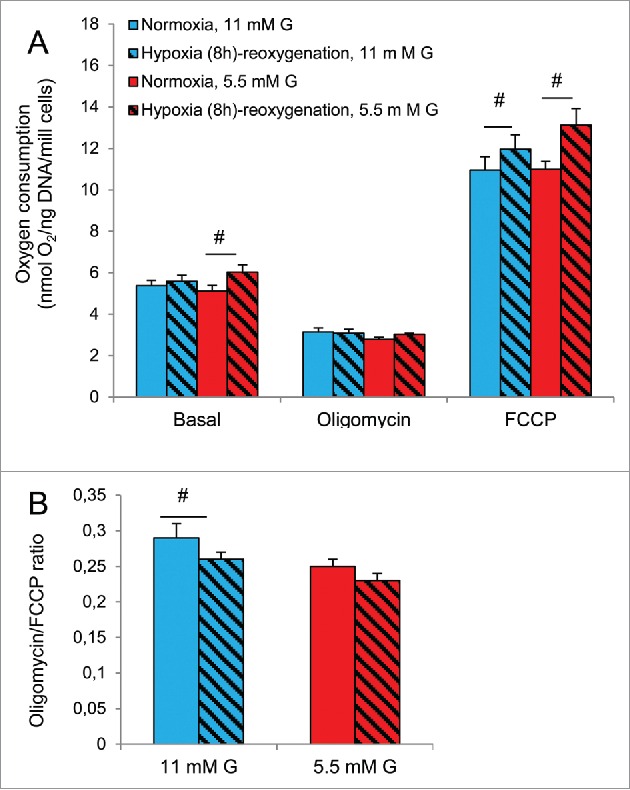
Figure 6.

Effects of hypoxia on oxygen consumption in INS-1 832/13 cells after culture at 5.5 or 11 mM glucose (G). Blue bars represent culture at standard G (11 mM), red bars represent culture at half standard G (5.5 mM). Patterned bars indicate exposure to 8 h of hypoxia followed by re-oxygenation. (A) Respiration at basal conditions, followed by conditions of ATP synthase inhibition by oligomycin and finally a non-coupled state achieved by FCCP. (B) Uncoupled (oligomycin) to FCCP-induced (FCCP) respiration ratio. #p < 0.05 or less for effects of hypoxia-reoxygenation. Data are mean ± SEM of 5 separate experiments, each consisting of 2-4 parallel measurements. Effects with culture at 11 mM glucose throughout were previously reported.13
