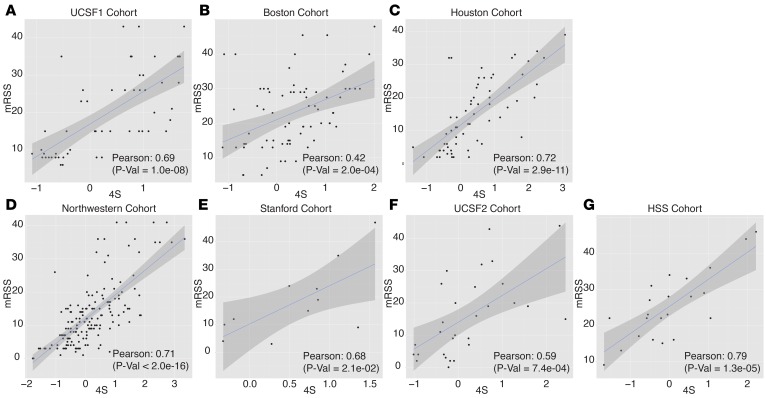
Figure 4. 4S is highly correlated with modified Rodnan skin score (mRSS) across all datasets.
Correlation plots comparing mRSS with the systemic sclerosis skin severity score (4S) for all of the datasets. Panels A and B (n = 54 and 72, respectively) are discovery cohorts and panels C–G (n = 66, 161, 13, 29, and 22, respectively) are validation cohorts. Each data point represents a patient skin biopsy. The blue line is the line of best fit and the gray region represents its 95% CI. HSS, Hospital for Special Surgery.

