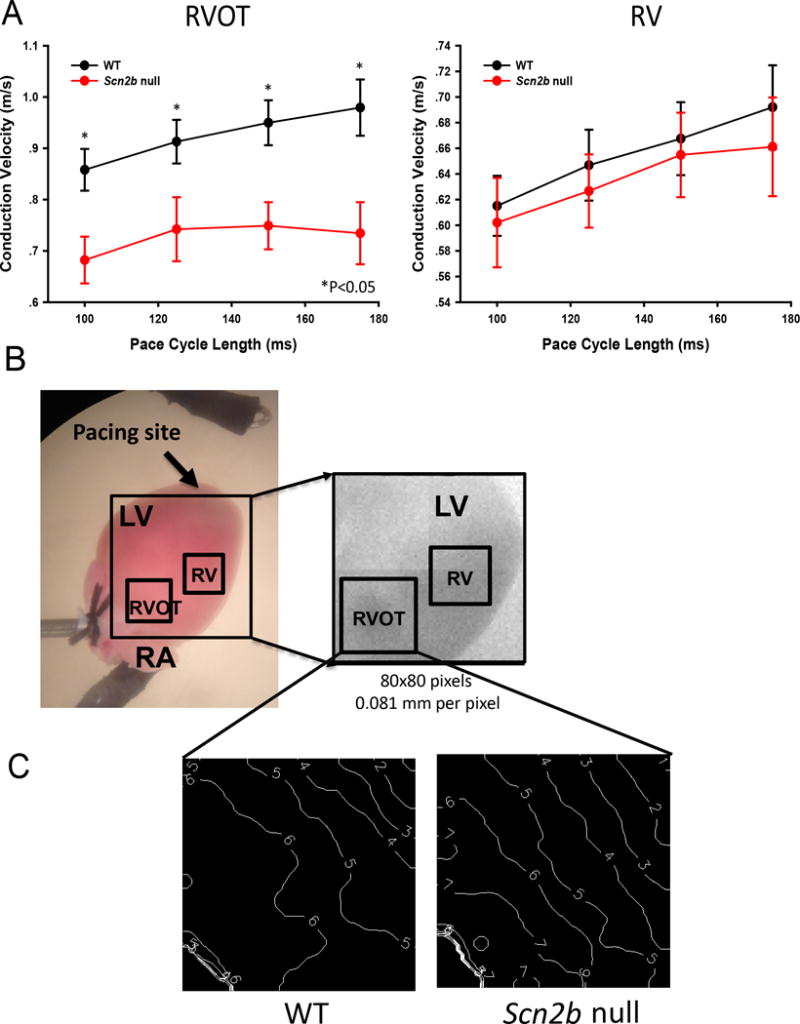
Figure 2.

Conduction velocity is decreased in the null RVOT. A. Conduction velocity is decreased in the RVOT but not RV free wall (null: N=9; WT: N=11) paced at cycle lengths (CL) of 100ms P=0.011; CL=125ms, P=0.032; CL=150ms *P=0.015; CL=175ms P=0.012; Student’s T-test or Mann-Whitney Rank Sum Test where applicable. B. Langendorff heart prep during optical mapping. Box: region of measurement. C. Representative activation maps from null and WT at 150 ms CL. White lines: isochrone lines. Numbers indicate time in ms. Isochrone lines show conduction slowing in the null RVOT. N: number of animals tested.
