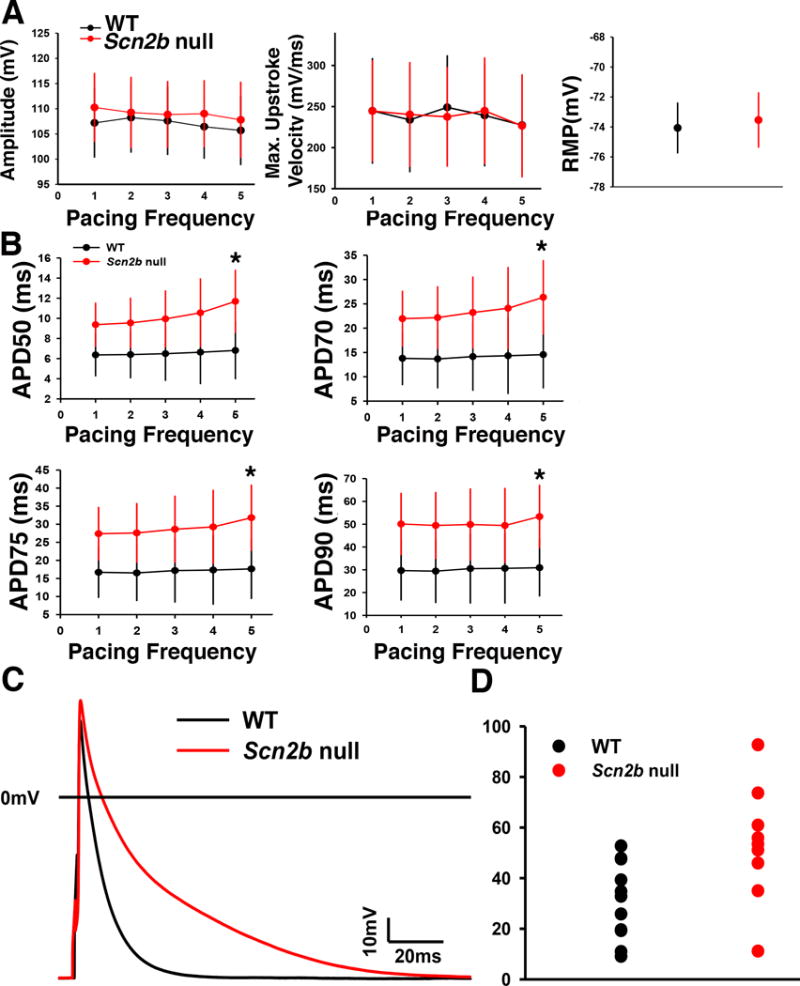
Figure 7.

AP recordings from right atrial myocytes. A. No differences between genotypes in AP amplitude, AP maximum upstroke velocity, or resting membrane potential. WT: black. Null: red. B. APD50–90 was prolonged in the nulls at a pacing frequency of 5 Hz (*P<0.05, MRE analysis,). C. Representative superimposed AP traces from null and WT myocytes. D. Distribution of the APD90 data paced at 5 Hz from atrial myocytes. APD lengthening in atrial myocytes is heterogeneous, resulting in a dispersed distribution of the data set (Null: n=13, N=4; WT: n=12, N=5, Student’s T test). WT: black. Null: red. Blue: mean. n: number of cells tested. N: number of animals tested.
