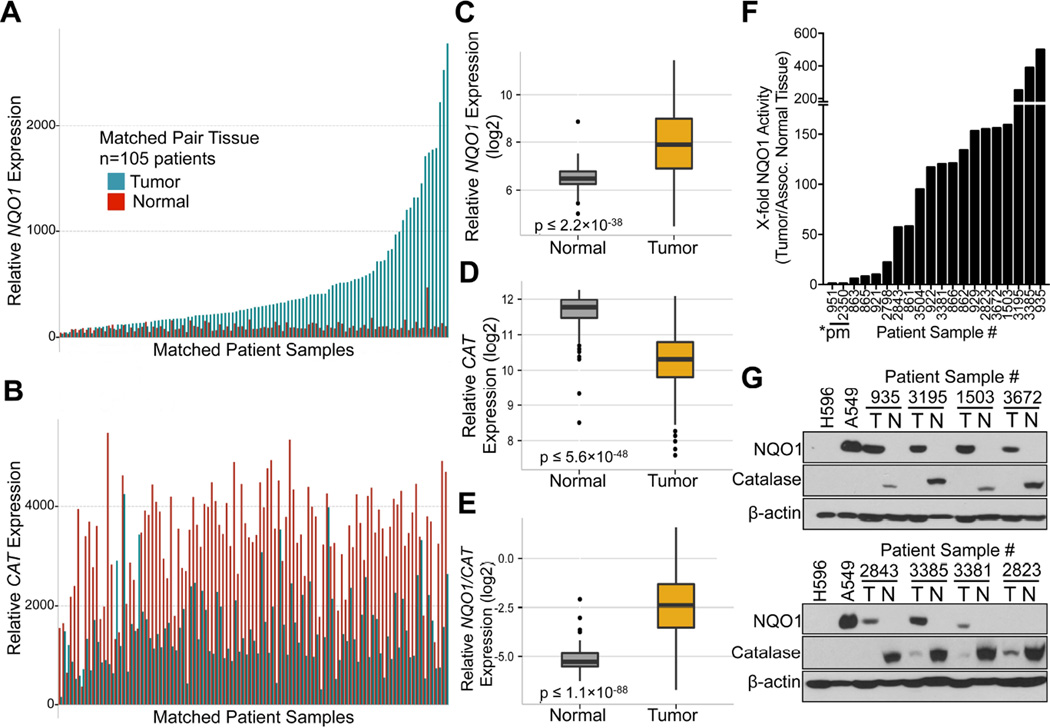
Figure 1. NQO1 and catalase (CAT) expression in NSCLC tumor vs normal tissue.
(A,B) mRNA expression data from matched NSCLC tumor and associated normal lung tissue (n=105) for: NQO1 (A) and CAT expression (B).
(C–G) NSCLC tumor (n=327) and associated normal lung (n=105) patient samples were analyzed for mRNA expression differences in NQO1 (p ≤ 2.2 X 10−38) (C); CAT (p ≤ 5.6 X 10−48) (D), and calculated NQO1/CAT ratios (p ≤ 1.1 X 10−88) (E). NQO1 enzyme activities (F): cytoC reduced/min/µg protein from fresh, snap-frozen patient NSCLC tumor tissue. *pm, *2 homozygous NQO1 polymorphism tumors with no enzyme expression. Steady state NQO1 and CAT protein levels were monitored from pathology-dissected de-identified patient NSCLC tumor (T) or associated normal (N) tissue by Western analyses (G). Box Plots show patient sample data for NQO1, CAT and NQO1/CAT ratios with lines representing means ± SD.
See also Figure S1.

