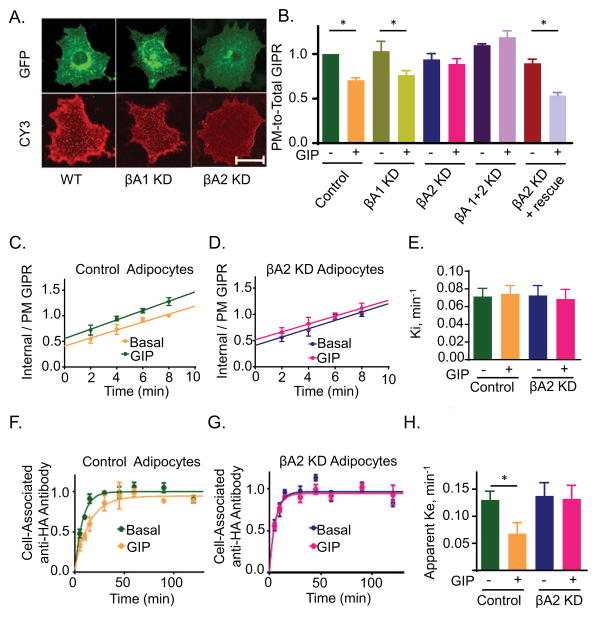
Fig. 1. βA2 is required for GIP-stimulated GIPR sequestration and slowed recycling.
(A) Fixed non-permeabilized adipocytes expressing HA-GIPR-GFP, with or without β-arrestin1 (βA1) or β-arrestin2 (βA2) knockdown (KD). Surface GIPR was stained with Cy3 using anti HA-epitope antibody. Epi fluorescence images. Scale bar: 50μm
(B) Quantitation of GIPR plasma membrane to total cell expression (PM-to-Total) distribution in basal and GIP-stimulated (100 nM, 60 min) cells. Adipocytes were electroporated with HA-GIPR-GFP and with no siRNA (WT), βA1, βA2 or βA1+2 siRNA. PM-to-total (Cy3/GFP) were determined as described in materials and methods. Data from individual experiments are normalized to the control cells in basal conditions. Data are averages of 9 independent experiments ± SD., P ≤ 0.05.
(C) GIPR internalization in WT adipocytes was measured as described in materials and methods. The slopes, which are the rate constant of internalization, are plotted in panel E. Data are averages ± SD of 9 independent experiments.
(D) GIPR internalization experiment in βA2 KD adipocytes. Data are averages ± SD of 9 independent experiments. Each βA2 KD experiment was accompanied by an experiment in WT adipocytes (shown in (C)).
(E) Internalization rate constants (Ki) for GIPR internalization in WT or βA2 KD adipocytes. The Ki were calculated as slopes of straight lines from (C) and (D). Data are averages of 9 independent experiments ± SD.
(F) GIPR Exocytosis was measured as described in materials and methods. Cell associated Cy3 normalized to GFP was plotted against time. Data are average ± SD of 9 independent experiments.
(G) GIPR exocytosis experiment in βA2 KD adipocytes. Data are averages ± SD of 9 independent experiments. Each βA2 KD experiment was accompanied by an experiment in WT adipocytes (shown in (F).
(H) Exocytic rate constants (Ke) for GIPR in WT or βA2 KD cells calculated from (F) and (G). The data were fit to a single-phase exponential rise equation. Data are averages of 9 independent experiments ± SD., p<0.05.
See also Fig S1.

