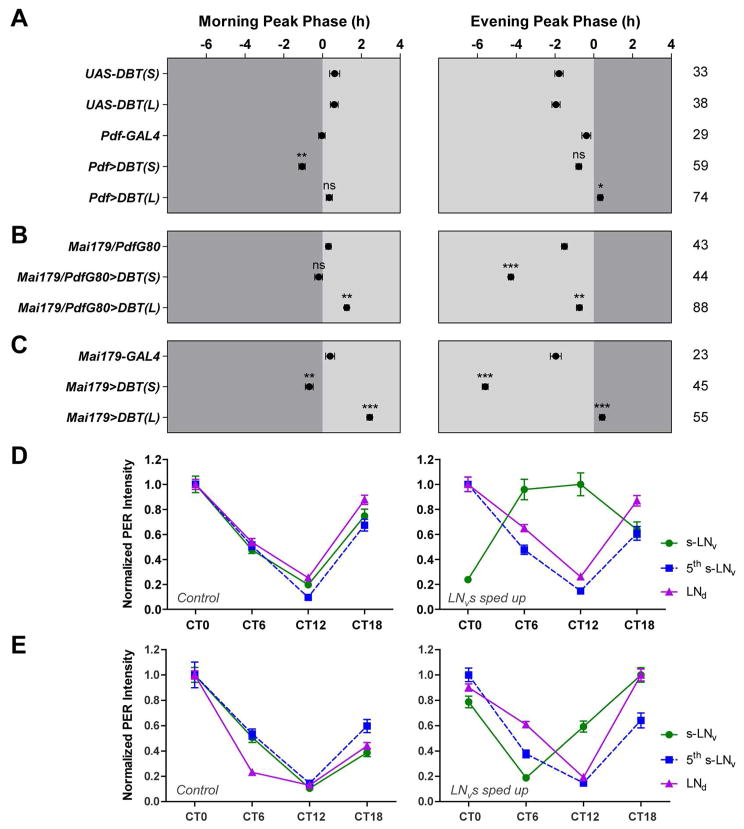
Figure 2. Morning and evening oscillators collaborate to control the timing of daily activity peaks.
(A–C) The average phases of morning and evening activity peaks in DD1 of the indicated genotypes. Genetic manipulations were targeted to the morning oscillator in (A), the 22 evening oscillator in (B), and both morning and evening oscillators in (C). See Table S1 for expression pattern of each genetic driver. “0” marks the time of subjective lights-on for the left panels and the time of subjective lights-off for the right panels. Dark gray indicates the subjective dark period and light gray indicates the subjective light period. The numbers of flies analyzed are indicated on the right of the phase panels. * P < 0.05; ** P < 0.01; *** P < 0.001; ns, not significant. See Experimental Procedures for details of the statistics.
(D) Normalized PER immunostaining intensity of the s-LNvs (morning oscillator), the 5th s-LNv (evening oscillator), and the LNds (evening oscillator) of UAS-DBTS control flies (left) and Pdf>DBTS flies (right).
(E) Normalized PER immunostaining intensity of different clock neuron classes of UAS-SGGHypo control flies (left) and Pdf>SGGHypo flies (right). Note that for UAS>SGGHypo flies (left), the troughs of PER oscillations in s-LNv, 5th s-LNv, and LNd are all at CT12, whereas for Pdf>SGGHypo flies (right), the trough of PER oscillation in s-LNv is at CT6 while those of 5th s-LNv and LNd remain at CT12. All the data in this figure are presented as mean ± SEM.

