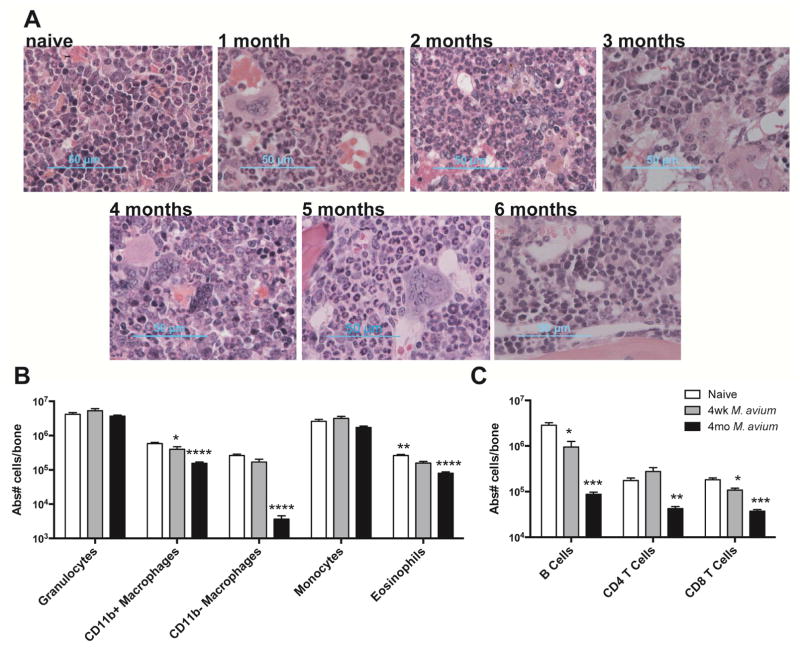
Figure 3. Myeloid cells infiltrate bone marrow during chronic infection.
(A) H&E stained sections of bone marrow from naïve and chronically infected animals. (B–C) Flow cytometry of WBM cells from naïve, 1 month or 4 month infected animals. Absolute number of cells per bone is shown. Data in (B–C) are presented as mean ± SEM; * p<0.05, ** p<0.01, *** p<0.001, **** p<0.0001. Data are representative of 2 independent experiments with n=4–7 per group. See also Figure S2&S3.

