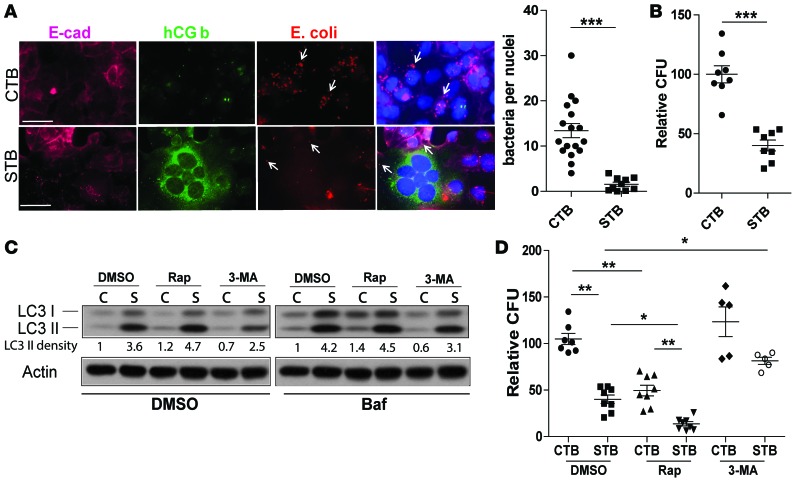
Figure 3. Autophagy contributes to STB resistance to bacterial colonization.
(A) Immunofluorescence microscopy of CTBs (BeWo) and STBs (forskolin-treated BeWo) exposed to E. coli (red). STBs are marked by expression of human chorionic gonadotropin β subunit (hCG b, green), and cell membranes were marked by E-cadherin (magenta). The number of intracellular E. coli per trophoblast cell nucleus is shown. n = 200 nuclei/group. ***P < 0.001 by Mann-Whitney U test. (B) Number of intracellular E. coli determined by counting colony-forming units in STBs relative to CTBs (set at 100%). ***P < 0.001 by Mann-Whitney U test. (C) Western blot detection of LC3 in DMSO-, rapamycin- (Rap-), and 3-MA–treated CTBs and STBs. Bafilomycin (Baf) treatment indicates that enhanced LC3 activity is due to autophagic flux. (D) CFU analysis of intracellular bacteria number in CTBs upon rapamycin and 3-MA treatment. CFU counts were compared with DMSO-treated CTBs. Scale bar: 50 μm. Data are expressed as mean ± SEM. *P < 0.05, **P < 0.01 using Kruskal-Wallis test with Dunnett’s post-test.

