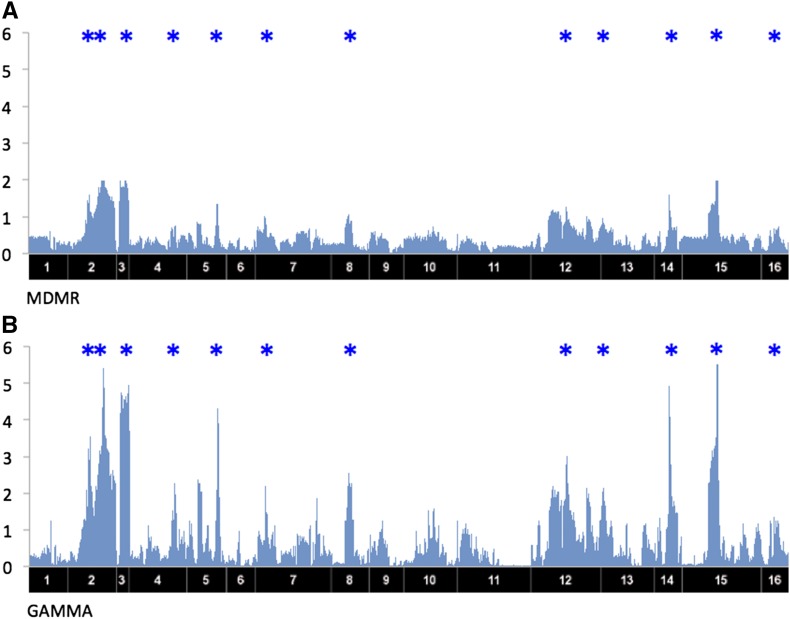
Figure 3.
The results of MDMR and GAMMA applied to a yeast data set. The x-axis corresponds to SNP locations and the y-axis corresponds to gene locations. The y-axis corresponds to −log10 of P-values. Blue * above each plot shows putative hotspots that were reported in a previous study (Joo et al. 2014) for the yeast data. (A) The result of MDMR. (B) The result of GAMMA.

