Figure 1.
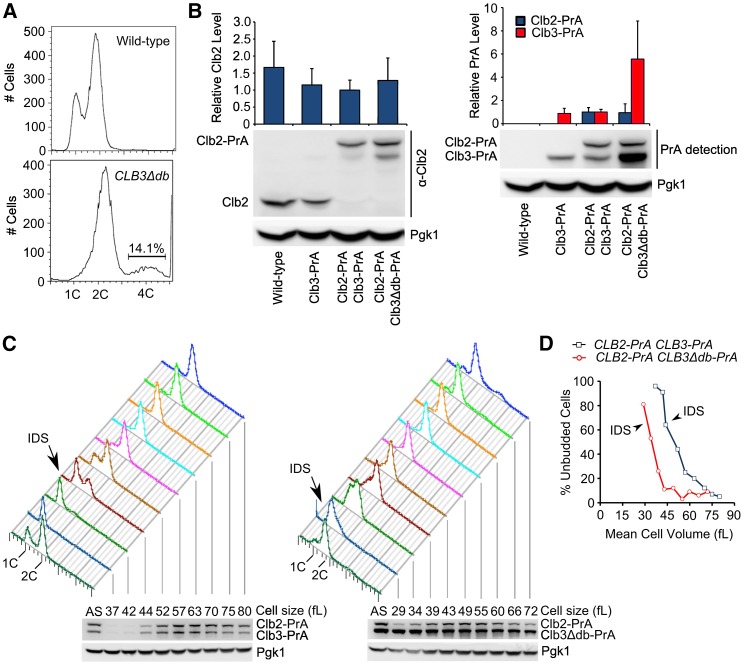
DNA content and protein abundance in asynchronous and elutriated cultures of CLB3∆db cells. (A) Representative FACS profiles of wild-type and CLB3∆db strains in log-phase asynchronous culture. (B) Clb2 and Protein A immunoblots from asynchronous cultures of Clb3-PrA Clb2-PrA and Clb3∆db-PrA Clb2-PrA strains (standardized to Pgk1, then to PrA signal in Clb3-PrA Clb2-PrA strain). Error bars are SD from two parallel Western blots with the same strains. (C) DNA content and Protein A level in elutriation fractions of Clb3-PrA Clb2-PrA and Clb3∆db-PrA Clb2-PrA strains. DNA content was determined by flow cytometric analysis. Protein levels in elutriation fractions, as shown in the immunoblot, were normalized to Pgk1. The first sample in FACS profiles and immunoblot (denoted by “AS”) is from asynchronous culture taken immediately before fractionation by elutriator. (D) Percent unbudded cells vs. mean cell volume in each elutriation fraction. Percentage of unbudded cells was determined by visual microscopic examination of a subset of each fraction (∼200 cells). Mean cell volume was measured by Coulter cell size analyzer. IDS, Initiation of DNA synthesis [as determined by flow cytometric analysis of DNA content; shown in (C)].

