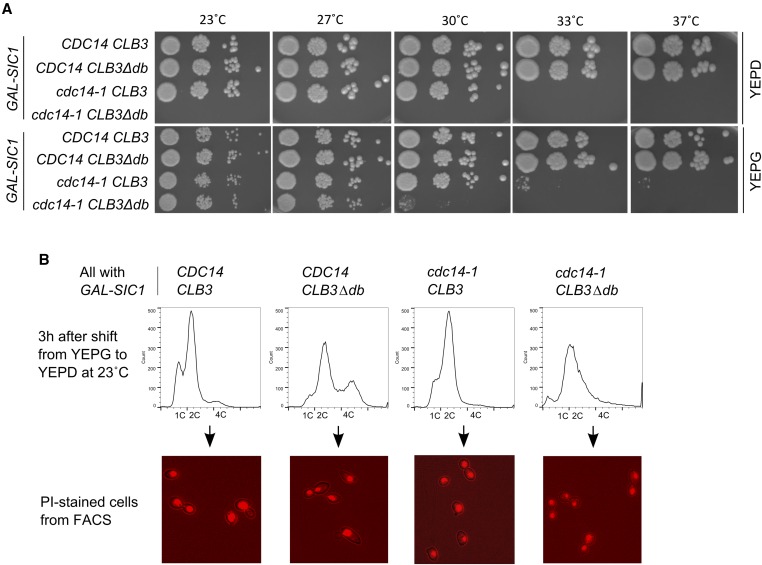
Figure 5.
Characterization of cdc14-1 CLB3∆db cells. (A) 10× serial dilutions of CDC14 CLB3, CDC14 CLB3∆db, cdc14-1 CLB3, and cdc14-1 CLB3∆db cells (all with GAL-SIC1) on YEP-Glucose (“YEPD”; GAL off) and YEP-Galactose (“YEPG”; GAL on) plates at various temperatures. (B) Top: DNA content measured 3 hr after shift from YEPG to YEPD medium at 23° (GAL-SIC1 off). Bottom: microscopic images of cells used for flow cytometry. Nuclei stained with PI.

