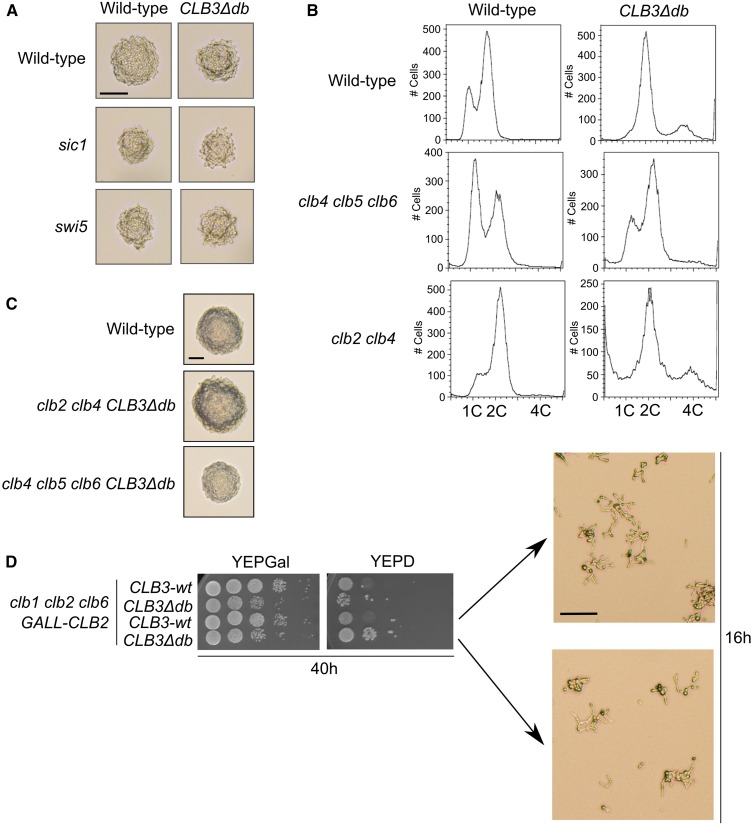
Figure 6.
Analysis of Clb3∆db function in mitosis, and testing for essential Clb-CDK inhibitors in a CLB3∆db background. (A) CLB3∆db/wt strains with and without sic1 or swi5 deletions. Images were taken 24 hr after induction of HO site cleavage. Bar, 50 μm. (B) FACS profiles of CLB3∆db/wt strains in either clb2 clb4 or clb4 clb5 clb6 backgrounds. (C) CLB3∆db/wt strains in either clb2 clb4 or clb4 clb5 clb6 backgrounds 24 hr after induction of HO site cleavage. Bar, 50 μm. (D) Serial dilutions of clb1 clb2::GALL-CLB2 CLB3∆db cells after 40 hr on YEPD to shut off GALL-CLB2. Bar, 50 μm.

